
We present the Active Adversary Report for Security Practitioners, analyzing data amassed by Sophos’ Incident Response team and covering the six quarters ending June 2023. This is the third and final Active Adversary Report of the year.
Our previous 2023 reports, which were geared toward business leaders (April) and tech leaders (August), focused on broad trends in attacker behavior. This report will dive deeper into topics that were noted but not previously highlighted, bringing forth findings that, though interesting from any cybersecurity point of view, are most likely to be actionable for security practitioners.
Unlike business leaders or tech leaders, who are primarily focused on strategy, operations, and resource deployment (both human and financial), practitioners are focused on finer details and actionable intelligence with which to protect the organization. Among the roles commonly handled by practitioners, threat hunters do the forward-facing work that, when done well, ensures the organization sees around corners when it needs to. And responders look backward to understand what happened on systems in crisis even as they scramble to get the situation back under control, and prevent similar outcomes in the future.
Key Takeaways
- Urgency on the part of the attackers does not (necessarily) constitute an emergency on the part of defenders
- Attack speeds change; attack directions and processes don’t
- Bad system hygiene matters more in fast times
- To slow down speeding attacks, just add some friction
- Defenders, a TAC!
Where the data comes from
 The Active Adversary Reports present what the X-Ops’ Incident Response (IR) team has learned about the current adversary landscape from tackling security crises around the world. This edition of the report is anchored in data from 232 cases selected from the data available from January 1, 2022 to June 30, 2023. We provide more detail on the demographics represented in this analysis at the end of the report.
This edition of the report expands our view to include information from X-Ops’ Managed Detection and Response (MDR) team, including a look at how that team frames their threat intelligence work in terms of Threat Activity Clusters (TACs). To illustrate one difference in perspective the MDR team will bring to these reports going forward, this edition includes a side-by-side comparison of two cases – one touching an existing MDR customer, one coming to Sophos through Incident Response. The attacks were similar at the outset, but we’ll show that the paths to wellness were very different.
Hunting High and Low
Security practitioners come from diverse backgrounds and fill an ever-growing roster of roles and capabilities in today’s organizations. As we assembled the findings in this report, we focused on threat hunters, analysts, and incident responders, and how they might use the information contained in a long-form report such as this. We’ll take a moment at the beginning of this report to outline what that means.
Once exclusively the domain of governments and large enterprises, threat hunting is becoming more commonplace in security teams as the function matures and demonstrates its value. Not everyone reading this report will be as intimately familiar with this specialized role as they are with incident response or with the many varieties of analysis. As such, we will attempt to summarize the threat hunter’s role as clearly and succinctly as possible.
One of the tenets of threat hunting is to “assume breach” and systematically go hunting for existing threats in the environment. This requires complete telemetry of the environment, since attackers will find and hide in your blind spots. (That’s if they don’t create the blind spot in the first place, which itself is an indicator of compromise [IoC]. More on that later in the report.) Early detection of potential threats allows for quicker response, which usually leads to better outcomes for the organization.
Threat hunters are both consumers and producers of threat intelligence; the sharing of intelligence within circles of professional trust inside the community is one of the great success stories of cybersecurity culture. Threat intelligence can be anything from a highly granular indicator such as an IP address or a file hash to broader campaign-level demographics. As the name implies, threat hunters literally comb through data in an environment, looking for these indicators of compromise. Existing IoCs inform the hunt, and new IoCs are added to the ever-expanding universe of threat intelligence data.
Another way that threat intelligence is gathered and fortified is through the work of incident responders. Unlike threat hunting, which is a proactive discipline, incident responders’ work is mostly reactive. They investigate detected breaches and ongoing active attacks with the objective of containing and mitigating the damage caused by security incidents, and returning the affected systems to a working state as quickly as possible. Incident response can be initiated by telemetry, from proactive threat hunts, or as a result of other procedural or institutional triggers.
When responding to an active threat, it is imperative that the time between spotting the initial indicator of compromise and full threat mitigation be as brief as possible. As an adversary progresses through the phases of an attack, it is a race against time to prevent them from achieving their objectives – and the deeper the adversary gets in the attack chain, the worse the defender’s prospects of catching up. With that long-understood truth in mind, the discovery in the previous report that dwell times have telescoped seemed to spell potential mayhem for defenders. This report is an effort to better understand, at the practitioner level, where that is and is not the case.
Movin’ Too Fast?
In the most recent Active Adversary report, we highlighted the precipitous decline in dwell time for all attacks. In particular, we noted a 44% year-on-year and 72% all-time drop in dwell time for ransomware attacks. These decreases were especially eye-catching with ransomware attacks, the dwell time of which decreased to a median of five days. One of our conclusions is that not only do ransomware attackers know that detection capabilities have improved, necessitating quicker attacks, but many are simply well-practiced.
They’ve had guidance. In the wake of the Conti leaks of early 2022, our threat researchers saw that many ransomware operators and affiliates were adopting the very well-developed playbooks authored by the notorious group. As with any process, iteration and practice tends to lead to better results. With modern ransomware turning 10 years old this year, practice has certainly made some of them proficient. This is doubly true when many defensive strategies haven’t kept pace.
It is with the ominous ransomware dwell-time decline in mind that we began to look at attacker dwell times in the five-days-or-less category. To be sure of the statistical significance of the dataset and to understand how these “fast” attacks develop, we chose to include all attacks we investigated in 2022 and the first six months of 2023, leaving out a single DDoS case that for various reasons did not lend itself to useful analysis here.
We first asked whether there are notable differences about faster attacks. The short answer is no. Most attacks, whether “fast” or “slow,” don’t appear to have any significant markers, other than speed, that would inform a change in defense strategy.
The first step to understanding the situation is to dig into the data. As shown in Figure 1, the distribution of attacks by dwell time offers a glimpse into the decline highlighted in our previous reporting. Even in this 18-month dataset, we can clearly see that longer attacks trend downwards. They’re simply not as common.
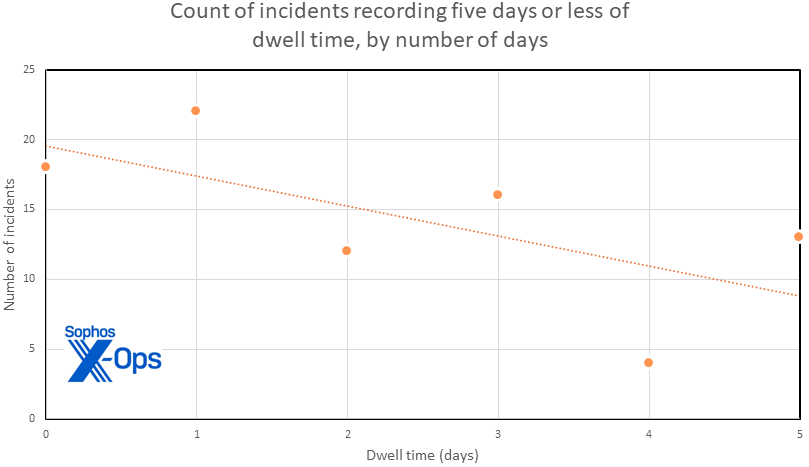
Figure 1: In this distribution of dwell times across the first five days of our fastest cases, there’s a fairly even (but declining) incidence of time spent in victim networks. There’s a fairly strong inverse trend visible between the length (in days) of dwell time and the number of cases confirming to that length of time
Looking further at the dataset, we see in Figure 2 that the trend of declining continues into the long tail of dwell time, with 50% of all attacks occurring within 9 days or less of initial access.
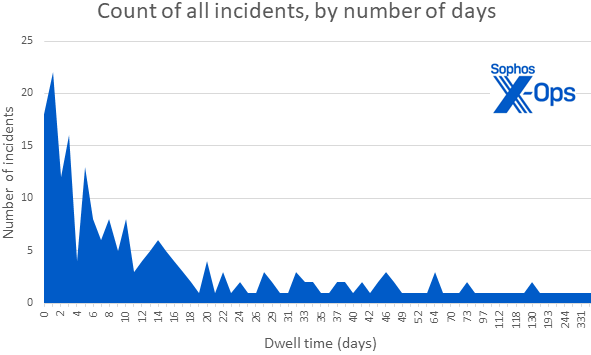
Figure 2: Incidents with dwell times of a month or more still occur, but they’re very much not the norm in the 18-month dataset. (Note that the X-axis scale shows incidence and is not to scale)
We then sorted our 18-month dataset into attacks with a dwell time of five days or less and attacks that lasted more than five days, in order to compare attack types, tools detected, LOLBin (living-off-the-land binary) use detected, and observed techniques to see what differences might be discoverable. We were looking for types of findings that could be strongly associated with either fast or slow attacks — or that could be equally associated with either type.
The data sorted into one group of 85 cases with dwell time of five days or less, 141 cases with dwell times of over five days, and six cases for which insufficient evidence existed to determine dwell time. (Such cases usually involve a telemetry failing, as we’ll discuss later in the report.) The cases in which dwell time could not be determined were excluded from the dwell-time analysis that follows, leaving a dataset of 226 cases.
Fast and slow vs attack types
Focusing our attention on attack types, we begin to see in Figure 3 how “fast” attacks (<= 5 days dwell time) do not vary significantly in type from “slow” ones (>5 days dwell time) for the most part.
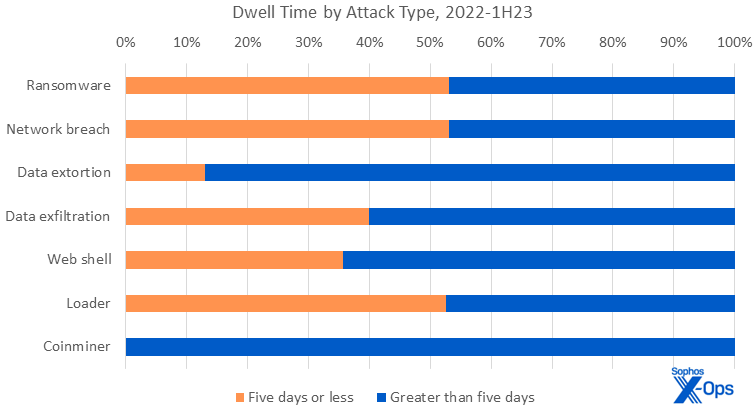
Figure 3: For ransomware, network breach, and loader attacks, it’s literally about fifty-fifty whether dwell time is fast (five days or less) or slow (longer than five days). Web shells and data exfiltration attacks are slightly more likely to have longer dwell times, and both data extortion and coinmining are more likely to have longer dwell times
Ransomware attacks, still the most prevalent type of attack, are distributed evenly across the data set of 226 cases. A similar observation can be made concerning (in descending order) network breach, loaders, data exfiltration, and web shells.
Amongst the outliers, coinminers are skewed by their low incidence in our dataset, but also by the fact that they are meant to be long-running. Coinminers will happily squat on a server, accruing fractions of a cent per month, in perpetuity. #web3isgoinggreat
Of note is the data extortion category, in which most but not all attacks fell into the “slower” dataset. In an extortion, the threat actors tend to remain longer in the network than in cases when data is simply exfiltrated but no extortion is attempted. We believe that since there is no encryption component to these attacks, the threat actors are able to operate more silently, and therefore more slowly and deliberately. This is all too often abetted by the target’s own lack of information on what their baseline traffic looks like — encryption creates substantial load on a system, but simple exfiltration without encryption does not, meaning that activity may be less noticeable. The problem is compounded when the target doesn’t monitor outbound traffic. In many cases, attackers were able to exfiltrate large quantities of data without notice.
Data exfiltration, a variation on data extortion (all extortions involve exfiltration of some sort; but not all exfiltrations include extortion), also tips slightly in the favor of longer attacks, for similar reasons. (“Data exfiltration” in our dataset indicates cases in which the data was confirmed to have left the affected network, but no further information is available as to what the attacker did with that data.)
Web shells, whether the work of initial access brokers (IABs) or dropped in support of some other sort of campaign, represent another category for which dwell times are expected to be longer.
Fast and slow vs root causes
We turn our attention next to root causes, looking at which if any are more closely associated with faster or with slower attacks.
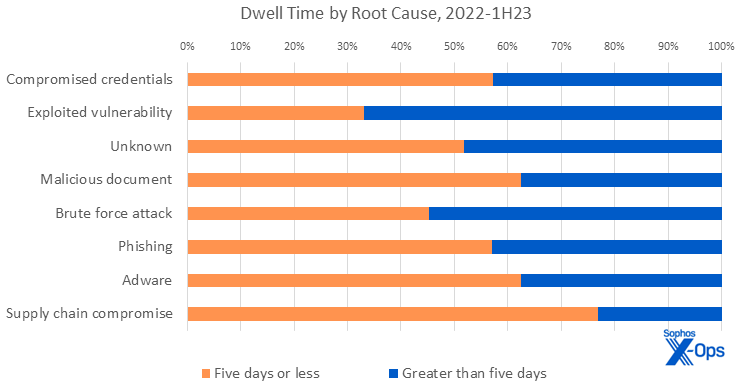
Figure 4: In those cases for which attacks could be ascribed to root causes, some interesting correlations between cause and duration became evident
The root causes of attacks show greater distribution. Compromised credentials, which rocketed to the top of the root-cause chart in the first half of 2023, have a slight prevalence in faster attacks. This is mostly due to the fact that there were also a higher proportion of fast attacks in the first six months of 2023.
Likewise, the incidents for which the root cause was a malicious document, phishing, adware, or a supply-chain compromise were more likely to move rapidly. On the other hand, about two-thirds of the attacks with roots in exploit of a system vulnerability were “slow” attacks, which again maps to that category’s decrease in the 2023 attack statistics. Unfortunately, the “unknown” category, which covers attacks for which the root cause cannot be derived from available data, still plagues both sides of the speed equation.
The notable outlier in this view of the data is supply chain attacks. Supply chain compromises are the prepared meal kits of threats — all the ingredients are there and it’s just a matter of making it happen. For example, Sophos incident responders investigated a knot of three related Hive ransomware incidents in 2022 that exemplify this scenario.
Those incidents started with compromised credentials being used against a single-factor VPN solution. Two-way trust relationships between all three domains meant that the compromised credentials were valid across the affected organizations, and persistent tunnels meant access was readily available. When the attacks started in earnest, there was very little time between them: Only 11 hours separated the abuse of the stolen credentials and persistent VPN tunnels. On the other end of the attack, there were less than 6 hours between ransomware deployments. In two of the cases, data was stolen about a day before the ransomware was deployed.
The administrative perils of supply-chain relationships are a topic best left for a later edition of this report. For practitioners, though, this story is not only an example of how this sort of attack can rip through multiple estates at top speed, but a reminder that supply chains pose additional risks and opportunities for defenders, which we’ll touch on later.
Where we observe the most uniform distribution between fast and slow incidents is in the tools, LOLBins, and especially the techniques used by attackers. The following section compares the top five results for fast and slow attacks in each of these three categories, ranked by prevalence. (Why are there more than five items in each list? The fifth item in some lists was actually further down the comparison table. We include them to ensure the top five items for both fast and slow attacks are represented in each category, and provide each table for clarity.)
Fast and slow vs the artifacts
As in previous reports, we look once again at the most commonly noted artifacts seen in the data. Both the April and August reports go into significant detail about those datasets. Since they are virtually unchanged since the August report, we will focus this time on comparing artifacts in fast and slow attacks.
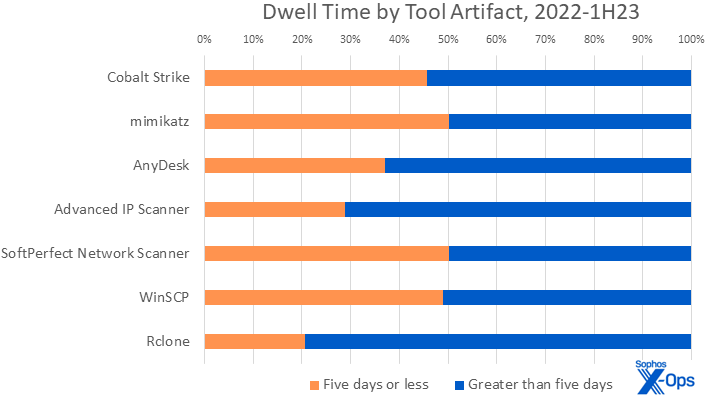
Figure 5: Of the tools most commonly brought onto the target network and deployed by attackers, there’s significant difference in usage between fast and slow attacks for only a handful of artifacts
| 2022-1H23 Tools Occurrence (by rank) | |||
| Rank | Five days or less | Greater than five days | Rank |
| 1 | Cobalt Strike | Cobalt Strike | 1 |
| 2 | mimikatz | AnyDesk | 2 |
| 3 | AnyDesk | mimikatz | 3 |
| 4 | SoftPerfect Network Scanner | Advanced IP Scanner | 4 |
| 5 | WinSCP | Rclone | 5 |
| 8 | Advanced IP Scanner | SoftPerfect Network Scanner | 7 |
| 18 | Rclone | WinSCP | 14 |
All 226 cases in this dataset included at least one artifact of tool use. Most of the tools were evenly distributed between faster and slower attacks. Mainstays such as Cobalt Strike, mimikatz, and AnyDesk occupied their natural spots in the top three of both lists, matching their ranking on the all-time list. Other attacker favorites, Advanced IP Scanner and SoftPerfect’s Network Scanner, fourth and fifth respectively on the all-time list, also ranked highly; tools such as network scanners are frequently (ab)used by attackers and their prevalence shifts over time, as we see here, but remain constant in the long run. File transfer tools WinSCP and Rclone round out the top 5.
As mentioned, the third most (ab)used tool in fast attacks (and all-time) is AnyDesk. Interestingly, the longer attacks used it more than the shorter ones. Generally, longer attacks see more use of remote access tools than faster ones. Remote access tools make up 40% of the top 10 tools versus 20% for fast attacks. (Perhaps faster attacks – particularly ones involving extortion rather than just encryption — don’t have as high a need for persistence, especially if you know you won’t be inside the network very long?)
Slight variations can also be seen in the choice of exfiltration tools. While WinSCP sees even usage between fast and slow attacks, practitioners will notice that Rclone is far less commonly seen in fast attacks. While we can’t really know why, it’s possible that Rclone’s somewhat less friendly interface makes it a less suitable candidate for smash-and-grab-style attacks. (On the other hand, WinSCP is well-suited to the kind of attacks that simply exfiltrate to attacker-controlled infrastructure; perhaps Rclone’s just too sophisticated for the smash-and-grab crowd. This is an excellent example of one indicator of compromise hinting at multiple potential lines of threat-hunter inquiry.) There were also more exfiltration attempts in the slower attacks, which means more opportunity to use a diverse toolset.
In the final two comparisons, we see that the LOLBins and techniques being used do not vary substantially between fast and slow attacks. Frankly, they simply work and there’s no incentive to change them until they stop working. Cybercriminals only innovate when they must, and only to the extent that it gets them to their target. For example, multifactor authentication (MFA) bypasses have been around for some time. It wasn’t until more organizations started deploying MFA (albeit only the most basic forms, such as SMS-based or TOTP), that we started seeing earnest attempts at circumvention. And as more phishing-resistant forms of MFA become commonplace, so will cookie stealing and authentication token theft.
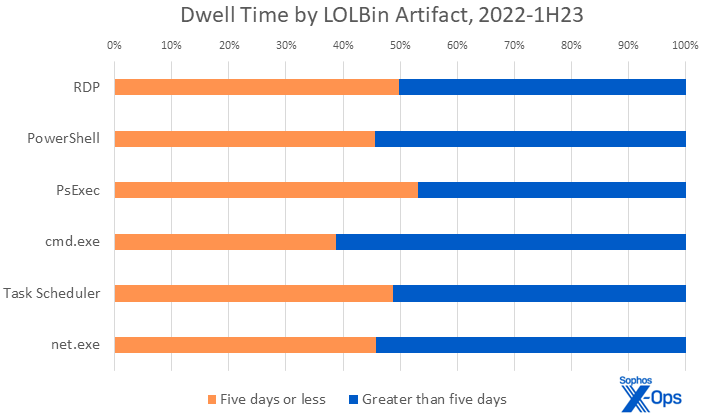
Figure 6: Just as the popularity rankings for LOLBins rarely change in our data, one can reasonably expect to see the same binaries abused whether the attack is fast or slow
| 2022-1H23 LOLBin Occurrence (by rank) | |||
| Rank | Five days or less | Greater than five days | Rank |
| 1 | RDP | RDP | 1 |
| 2 | PowerShell | PowerShell | 2 |
| 3 | PsExec | Cmd.exe | 3 |
| 4 | Cmd.exe | PsExec | 4 |
| 5 | Task Scheduler | net.exe | 5 |
| 6 | net.exe | Task Scheduler | 6 |
In this dataset, 218 cases included at least one artifact of LOLBin abuse. The majority of the most commonly abused LOLBins are commandeered because they’re useful and common, so it should be to no one’s surprise that Remote Desktop Protocol (RDP) comes out on top in either ranking. With some slight variations in the percentages, the remaining LOLBins track well within statistical variability. Practitioners should expect LOLBin exploitation to remain relatively stable over time; when looking at the top 20 LOLBins in either fast or slow attacks, 90% occur in both lists, and occupy the same spot in their respective rankings.
The category exhibiting the most parity between fast and slow attacks is the catchall “Techniques” (or ‘Other”) category – showing, once more, that whether the attackers are fast or slow, they are still recognizably the same attacks. To discern differences, we’ll need to establish the basics and then get more granular.
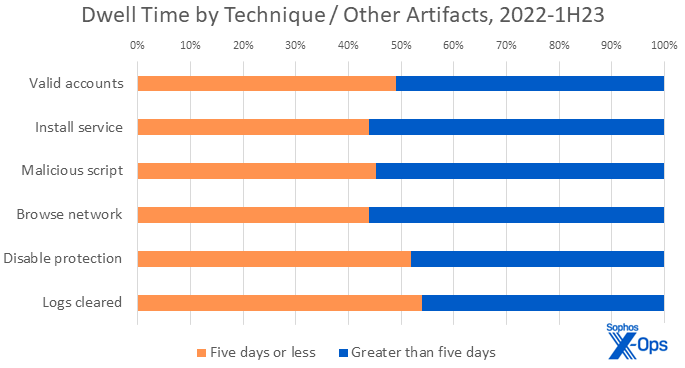
Figure 7: A chart with all the tidal variation of a collect pond, the distribution of techniques seen in fast and slow attack is virtually the same
| 2022-1H23 Techniques (“Other”) Occurrence (by rank) | |||
| Rank | Five days or less | Greater than five days | Rank |
| 1 | Valid accounts | Valid accounts | 1 |
| 2 | Install service | Install service | 2 |
| 3 | Malicious scripts | Malicious scripts | 3 |
| 4 | Disable protection | Browse network | 4 |
| 5 | Logs cleared | Disable protection | 5 |
| 6 | Browse network | Logs cleared | 6 |
In this dataset, all cases included at least one artifact of other tool or technique use. Valid accounts, for instance, are useful no matter the speed of the attacker. We noted in our August report that we saw valid accounts were paired with external remote services 70% of the time. In this comparison we observed the same pairing, but in different proportions for fast or slow attacks: Fast attacks saw the paring 75% of the time, compared to 62% for slower attacks. In the fast cases where valid accounts were used, 88% did not have MFA configured. Having valid credentials makes illicit access easy; not having to deal with MFA makes it trivial. And again, as with LOLBins, the techniques in both lists do not vary much. There is an 80% overlap between the top lists of fast or slow attacks.
We conclude that with a few exceptions, the tools and techniques observed in fast attacks mirror the type and proportion of those seen in longer attacks.
In our previous report, we mentioned that attackers are increasingly disabling protection as a means of evading detection, but it has the side effect of reducing telemetry, putting defenders on the back foot. It’s with that in mind that we decided to look back at the 2023 data to see the state of logging within organizations.
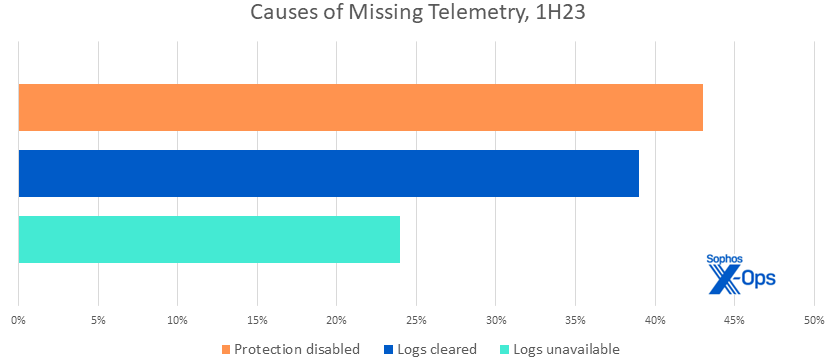
Figure 8: Missing telemetry complicates response and defense; a quick examination of the 1H23 data shows various reasons it was not available to investigators for cases during that timeframe. Since more than one reason can be true in any given attack, the percentages add up to well over 100 percent
Alarmingly, nearly a quarter of the organizations we investigated simply didn’t have appropriate logging available for incident responders. This was due to a variety of factors, including insufficient retention, re-imaging, or lack of configuration. In an investigation, not only would this mean the data would be unavailable for examination, but the defenders would have to spend time figuring out why it wasn’t available.
Now that Microsoft has (as of September 2023) begun to make logging free and available for basic licenses, there’s no reason not to use it to its fullest when it’s rolled out to your enterprise. Hands-on practitioners may not be in a position to decide this for their enterprises, but it’s important that they make the case if the case isn’t being made by leadership. And, like many other types of data, logs should be securely backed up so they can be used in the event that a forensic analysis is required. (The classic confidentiality-integrity-availability trinity is not usually top-of-mind for the practitioner crowd, but it’s worth invoking here to speak the leadership language that’ll get the necessary processes in place.)
Zero
OK, so there’s no discernible difference in the way attacks unfold at the day scale, but there must be when we look at hours, right? While the story of 2023 so far has been speed, looking at ever smaller time slices doesn’t reveal anything revolutionary. The demographics of the faster attacks reflect those over a longer time scale, as do the attack types and root causes. Ransomware still dominates (61%) and compromised credentials (44%) are the leading root cause followed by exploited vulnerabilities (22%). Nearly three-quarters of cases abused RDP and the rankings for tools, LOLBins and techniques are nearly identical to their longer cousins.
So, if the ever-shrinking time scales don’t change our approach to defense, what does? In short, it comes down to having eyes on the environment and acting quickly when problems surface. Whether that’s from an active threat hunt or an alert from one of your security products. There is a world of difference between those organizations that actively monitor and respond to IoCs and those who don’t. Don’t blame yourself for what you can’t ignore. Instead, find a way to close the gap between your current capabilities and where you need to be. And, with respect to Zeno’s paradox, while perfect detection can never be achieved, you will never be sorry that you tried to be as observant and as thorough as you could.
sTACed Actors
Of course it’s easy to say in a report like this that practitioners should be observing as much as they can as thoroughly as they can. The problem is finding ways to do so effectively, since even if the traces of attacks (fast or slow) haven’t really changed, the volume of material to parse increases constantly. A closely related problem involves effective knowledge sharing. Even if one practitioner has useful observations and information, what’s the most effective way to convey those to others working on similar problems, preferably in a way that helps defenders draw further useful information from that work?
To solve this problem in our own research, Sophos in 2023 has been building up a Threat Activity Cluster (TAC) nomenclature. We wrote about this several months ago, and provide a bit more information on the process in this report for defenders curious to learn more.
Rather than attempting to identify specific adversaries and then accruing data about each one’s TTPs, TACs focus less on the who and more on the what, on the theory that defending against the “what” (tightly related TTPs and victimology, time-date proximity) will cover whoever the “who” may be.
So far this has been a productive approach for our own threat hunters and intel analysts. TAC thinking enables us to quickly spot patterns even when some of the matches in available data are a bit “fuzzy,” and lets us see through attacker shenanigans such as changes in tool usage, or groups that break up and reassemble under another name (but do the same old attacks in the same old way; most attacker groups are after all happy to reuse the same old TTPs as long as they’re working). TAC thinking also helps us to look at research from industry peers and see previously unnoticed relationships and evolutions.
The nomenclature itself is wonderfully boring. As clusters of behaviors are identified, they are given a four-digit number, the first digit of which indicates broadly what the cluster was involved in (or, if you prefer, the motivation of the behavior). So far:
1 – State-Sponsored
2 – Hacktivist
3 – Initial Access Broker
4 – Financially Motivated (eg., malicious advertising)
5 – Ransomware
6 – Unknown (an identifiable cluster of behaviors exists, but more research is needed)
Focusing on what clusters of findings do, rather than where or with whom they might originate, allows the team to see surprising things. These include our recently published findings on a major change in tooling for the Vice Society gang (which is now, as our research shows, more correctly described as the Rhysida gang). More broadly, clustering means that threat-actor attribution doesn’t overshadow other artifacts such as tool use or attack type. This leads us to useful correlations among those three datasets.
As an example, we present here a side-by-side comparison of two cases – a twin detective story, if you will. One case touched an existing MDR customer, one came to Sophos through Incident Response.
Watching The Detectives
Our story begins in Cuba – or at least in the Cuba ransomware, the infectant in both the cases we’ll review. Both cases occurred in 2023 and both affected US-based entities (albeit in different business sectors). For simplicity, we will call them “Red” and “Blue,” and since this is a story for security practitioners, we’ll immediately spoil the ending by telling you how it worked out for each case.
| Red Got and Blue: A Tale of Two Cuba Attacks | |
|
“Red” |
“Blue” |
| 8 artifacts logged | 203 artifacts logged |
| 2 devices affected | 215 devices affected |
| 0 accounts compromised | 9 accounts compromised |
| 2 servers isolated | All servers and PCs isolated |
| 2 days to BAU (Business As Usual) | 60+ days to BAU |
| No data exfiltrated | 75GB exfiltrated |
| Data leaked on threat actor’s site | |
The Beginning
The first hour of the first day started off much the same for Red and Blue, with defense evasion attempts including the driver C:\Windows\Temp\aswArPot.sys. (This exploit is known for terminating processes at the kernel level.)
What Red Saw: The attacker also attempted to load a second file, C:\Windows\Temp\av.bat. Sophos Anti-Virus detected and terminated / deleted both attempts.
What Blue Saw: The attacker attempted to execute other defense-evasion techniques. At this point, the system information later made available to Sophos X-Ops investigators indicated that a Cobalt Strike C2 had just dropped, and there are also authorizations from an unmanaged IP address.
Setting Up Shop, Or Not
The first hour has passed. The two paths begin to diverge, as Cuba attempts to fully establish itself. On both systems, within the next 60 minutes three more IoCs (C:\Windows\Temp\130.bat, C:\Windows\Temp\130.dll, C:\Windows\Temp\auto.dll) execute, followed by attempted outreach to 38.135.122.[.]130/Agent64.bin – a Cuba ransomware C2.
What Red Saw: The combination of the file executions plus the known Cuba C2 address are enough evidence for MDR, and the system generates a case for SOPHOS-DET-WINDOWS-BEHAVIORAL-MALWARE-C2_11a (T1071.001). (The MITRE ATT&CK notation at the end tells observers that the flagged behavior involves application-level protocols associated with web traffic.)
What Blue Saw: Nothing, but behind the scenes the threat actor is busy – dropping additional ransomware binaries and (likely) compromising an admin-level user. More malicious tools and LOLBin usage will be seen in the logs, particularly AVKill and PSExec. Blue has a few Sophos tools in place here and there, such as CryptoGuard, but its alerts this day on Cobalt Strike and KillAV go unnoted.
A Three-Hour Tour
Three hours have passed since the start of each incident; enter Sophos humans, at least on one side of the equation.
What Red Saw: After isolating two suspicious-looking hosts on the customer’s network, an MDR analyst reaches out to let the customer know what has taken place, and to recommend that they block the detected C2s. The malicious files are taken off the affected devices and submitted to SophosLabs for further scrutiny.
What Blue Saw: No formal monitoring was in place, but according to reconstructions of the timeline and interviews after the fact with the targeted enterprise, the signs of trouble (specifically, Cobalt Strike) were already getting some in-house attention. PSExec is now present on affected devices, and SSL-encrypted traffic is flowing to Russian IP addresses. At this point telemetry also indicates the attacker had reached Blue’s Active Directory, a sign of trouble we talked a great deal about in our last report.
Go On Without Me
Two days have passed. This is where Red’s story ends. Blue’s is just beginning.
What Red Saw: In the intervening days, the two affected servers at the customer estate are cleaned up and sent back into use. The ransomware is eradicated; no data encryption or exfiltration took place, and the customer is back to business as usual.
What Blue Saw: By now, the attackers have compromised multiple user accounts and are phoning home to two additional C2s associated with the Cuba campaign. Over the next two weeks, the attackers will reach out to another IP address (64.235.39[.]82) to download additional malware. They’ll also spread additional malicious binaries across the estate, including the Backstab binary, which terminates privileged system processes; a batch script to install KillAV and disable whatever antimalware protections may be running; and an additional piece of malware targeting Microsoft ZeroLogon vulnerabilities. (The KillAV attempt raised another flag with the Sophos wares on the system, but again there was no follow-up.) System administrators are aware something’s not right. They’ll find out what soon.
Making Themselves Known
Two weeks have passed. During an overnight shift, an employee at Blue found their files encrypted; they alerted the helpdesk. When a second department reported similar trouble near the end of that shift, Blue reached out to Sophos X-Ops IR. Within a few hours, the Sophos IR team started its investigation.
What Blue Saw: Blue’s IT department is by now half a miserable month into playing whack-a-mole — blocking binaries, identifying at least one compromised account, and figuring out which machines were secretly allowing RDP access to the network. However, when users started discovering files encrypted and sporting a new .cuba file extension, they called outside IR. As IR and the new customer scramble to identify affected infrastructure, crown jewels, and what logs and backups may be available, it’s discovered that nearly 80GB of so-far-unidentified data was exfiltrated to an IP address known to be associated with this threat actor. Among the findings were a welter of CryptoGuard alerts on the ransomware execution starting several hours before the event. Exfiltration began about an hour before impact and lasted about an hour.
All PCs and servers are now shut down across the organization.
But Wait! There’s More!
This is the part of the story no one wants to hear. Four days after locking up Blue’s estate, the Cuba gang leaked the stolen data. This is where we leave Blue – lawyers handling the legal aspects of a large data leak, IT restoring from backups made earlier in the year. The ultimate time back to business-as-usual was just over nine weeks.
If there’s a moral to this story, aside from There Are Some Horrible People In The World, it’s that no one is alone, or should be alone, when it comes to security practice. Single-player whack-a-mole is a venerable but unwinnable game, especially when you’re attempting to do multiple practitioner roles (hunting, responding, analyzing, restoring) at once. Circles of trust – among industry colleagues, among professional organizations, and within the organization itself — may be the only hope most enterprises have of leveling the playing field.
Conclusion
To turn attackers’ own behavior against them, we must increase friction wherever possible. If your systems are well maintained, attackers have to do more to subvert them. That takes time, and increases the detection window. Fancy techniques such as “bring your own vulnerable driver” (BYOVD) attacks are fourth or fifth in line on most attackers’ list of options, after everything else fails and they need to go “nuclear.” Robust layered defenses – including ubiquitous, sturdy protections and monitoring — equal friction, which increases the skill level the attacker needs to bring to the table. Many simply won’t have what it takes and will move on to easier targets.
We must protect everything. Not only does protection provide a chance at prevention, but it also comes with much-needed telemetry. If an asset cannot be protected in situ, it must be isolated and access to it controlled and monitored. Simply eschewing protection for fear that it may adversely affect performance is not the answer, and ignoring or papering over gaps in protection leaves attack surfaces open. You must protect ya neck.
The benefit of complete telemetry means that organizations can have their own eye in the sky so they can always be watching. Complete telemetry eliminates deliberate blind spots, but also acts as a beacon when blind spots are created by attackers. A telemetry signal going dark is an event that needs to be investigated. Monitoring extends beyond the network and operating systems to understanding when a specific event is rare and sinister. For example, registry changes – seen in 26% of investigations and #8 on the list of techniques – are often used by attackers to modify systems into a more compliant state, subvert their protections, or obfuscate their activity. Such changes should be rare on servers and should always be evaluated as a potential threat indicator; your watching eyes should see that sort of thing every single time it happens. You are the maker of rules, deal with these fools.
An integral part of monitoring, beyond proactively looking at the telemetry, is this sort of understanding of what the information means. Many organizations collect vast amounts of telemetry but struggle to pick out relevant and important signals. This is where experienced threat hunters, and (later) incident responders, come in. Threat hunters understand the business, they know what normal looks like, and they’re on top of all the dirty tricks attackers have at their fingertips. Together with incident responders they know how and when to initiate a response. Be ready to investigate — it can mean the difference between cleaning up a pesky coinminer or rebuilding the entire environment from backup.
In the words of the great combat strategist (be that Moltke or Eisenhower or Tyson), everyone’s got a plan until the trouble starts. That said, have response plans for the types of attacks most likely to affect your enterprise, and practice those plans in advance with both your security practitioners and the other company stakeholders on whom you’d need to rely in a crisis. The process will help you to identify and address system weaknesses before attackers do. Many Sophos IR investigations start after organizations attempt their own recovery and fail. This is not an indictment on those who try, but a signal that many organizations need help in the first place. A critical and honest assessment of capabilities should tease this out. Open up the doors and ask for help.
Security practitioners in general and threat hunters in particular have found ways to build and feed circles of trust to share findings and marshal defender forces. Prudent participation in these lets others learn from your mistakes (and successes), and you from theirs. Organizations working on building these relationships should establish good in-house communications to determine what, how, and with whom they will share.
What have we learned from analyzing all this data? In short, whether fast or slow, it doesn’t much matter: Other than speed, there is no tangible difference between fast and slow attacks. The fast attacks are a 78rpm playback of the slower ones; the song remains the same.
That may sound like we’re advising defenders to just give up. We are not. Instead, defenders need to set aside the idea that increased attack speed makes defense’s job foundationally different. In fact, some of the protections for which defenders have always been responsible just might – if done scrupulously – make attackers’ need for speed a weapon for defenders. Where there is urgency, there is error; attackers’ speed is likely to make them noisier, and if practitioners are listening at the hands-on level those signals won’t go to waste.
Acknowledgements
Colin Cowie, Morgan Demboski, Karla Soler, Mauricio Valdivieso, and Hilary Wood contributed to the research presented in this report.
Appendix A: Demographics and methodology
For this report, 83% of the dataset was derived from organizations with fewer than 1000 employees. As in previous years, greater than 50% of organizations requiring our assistance have 250 employees or fewer. For a detailed look at our demographics for years prior to 2023, please refer to the Active Adversary Report for Business Leaders, published earlier this year.
To examine the dwell-time trend over 18 months of data we looked at cases from 2022 and the first half of 2023. For the side-by-side comparison of two similar cases (“Watching the Detectives”), we selected an Incident Response case that fell outside that 18-month dataset; the details of that case are not represented elsewhere in the report statistics. Likewise, the MDR case is not represented elsewhere in the report.
Protecting the confidential relationship between Sophos and our customers is of course our first priority, and the data you see here has been vetted at multiple stages during this process to ensure that no single customer is identifiable through this data – and that no single customer’s data skews the aggregate inappropriately. When in doubt about a specific case, we excluded that customer’s data from the dataset.
Nations represented (2022-1H2023)
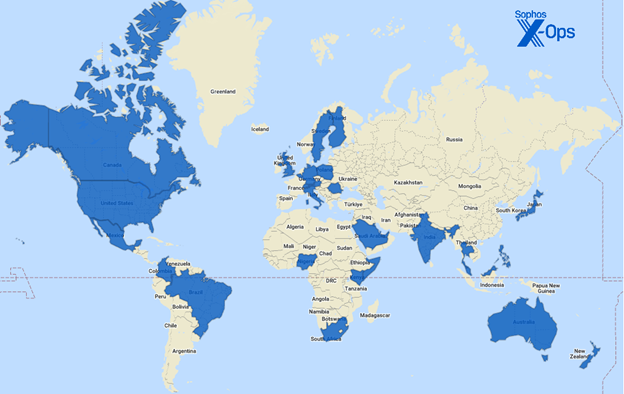
Figure A1: The thirty-four countries we visited (virtually or otherwise) in 2022 and the first half of 2023
| Australia | Japan | Singapore |
| Austria | Kenya | Somalia |
| Bahrain | Kuwait | South Africa |
| Belgium | Malaysia | Spain |
| Brazil | Mexico | Sweden |
| Canada | New Zealand | Switzerland |
| Colombia | Nigeria | Thailand |
| Finland | Philippines | United Arab Emirates |
| Germany | Poland | United Kingdom of Great Britain and Northern Ireland |
| Hong Kong | Qatar | |
| India | Romania | United States of America |
| Italy | Saudi Arabia |
Industries represented (2022-1H2023)
| Architecture | Government | News Media |
| Communication | Healthcare | Non-profit |
| Construction | Hospitality | Pharmaceutical |
| Education | Information Technology | Real estate |
| Electronics | Legal | Retail |
| Energy | Logistics | Services |
| Entertainment | Manufacturing | Transportation |
| Financial | Mining | |
| Food | MSP/Hosting |
Methodology
The data in this report was captured over the course of individual investigations undertaken by Sophos’ X-Ops Incident Response team. The Sophos MDR data described in the “Watching the Detectives” comparison was captured in the course of normal MDR services provided to that customer.
When data was unclear or unavailable, the author worked with individual IR case leads and/or MDR analysts to clear up questions or confusion. Incidents that could not be clarified sufficiently for the purpose of the report, or about which we concluded that inclusion risked exposure or other potential harm to the Sophos-client relationship, were set aside. We then examined each remaining case’s timeline to gain further clarity on such matters as initial access, dwell time, exfiltration, and so forth.
Pete
Is the “Active Adversary Report” this news article or is there a larger report which can be downloaded somewhere?
Angela Gunn
Hi Pete — this post is the report itself (all 6806 words of it), but there’s a PDF version of the page if you’d rather read in that format, By the time you see this comment there should be a beige box near the top of the page, and clicking that will get you to the PDF. Thanks for asking.
Pete
Thanks a lot for clarification :)