
We present the midyear Active Adversary Report for Tech Leaders, analyzing data amassed by Sophos’ Incident Response team and covering the first half of calendar year 2023. This is the second Active Adversary Report of the year.
The previous Active Adversary Report, published in April, was aimed at business leaders. In the infosecurity context, business leaders are the ones setting the strategy and overseeing the finances of their respective organizations. When it comes to cybersecurity, business leaders are charged with being broadly aware of current threats and the risks those threats pose to the organization. They must also broadly understand the mitigations that reduce that risk, though not necessarily all the details. With this knowledge, they can hopefully set appropriate priorities and budgets. In return, they expect reliable metrics that can help them evaluate how the department is performing against the strategy they propose.
Tech leaders – the audience for which this second report is written — are the ones who operationalize the strategy. They deploy the necessary resources, both monetary and human, that most efficiently accomplish the goals set out in the strategy. These leaders must carefully balance the priorities of those setting fiduciary policy for the enterprise and those doing the hands-on work of threat hunting (the group we’ll address in the next Active Adversary Report). They are, frankly, the glue of infosec in the enterprise.
This midyear report seeks to help these leaders make better decisions about how to deploy their resources to best satisfy corporate strategy and better protect the organization. What follows are some of the findings we believe are most germane to that process, showing the “bottlenecks” at which judicious action can deliver the biggest impact. The report also sketches out how hands-on-keyboard adversaries view their targets – as a scheduling issue, as a set of puzzles to be solved, and as a locus of discrete actions meant to produce specific, profitable results.
The report presents what the X-Ops’ Incident Response (IR) team has learned about the current adversary landscape from tackling security crises around the world. This report is anchored on data from 80 cases selected from the first half of 2023. We will also compare this dataset with a look at earlier Active Adversary data to see how things have changed over time. We provide more detail on the demographics represented in this analysis at the end of the report.
Key Takeaways
- Compromised credentials are a gift that keeps on giving (your stuff away)
- MFA is your mature, sensible friend
- Dwell time is sinking faster than RMS Titanic
- Criminals don’t take time off; neither can you*
- Active Directory servers: The ultimate attacker tool
- RDP: High time to decline the risk
- Missing telemetry just makes things harder
* Of course we know individual criminals take time off to rest and recharge, but not all the criminals at once. We’re also not suggesting that defenders should never take a break from work — that’s a recipe for disaster. Rather, your organization needs to have the capabilities to detect and respond 24/7/365. For a look at the data supporting this claim, read on.
Where the data comes from
Previous reports have focused on retrospective analyses of full-year incident response data. To provide better visibility into current attacker behaviors, we’ve decided to focus this report on the first six months of 2023, comparing it to earlier data where relevant. This allows us to provide readers with fresh data and insights, while affording us the opportunity to spot evolutions from data in previous reports. Appendix A, below, includes detailed information on the cases selected for this edition of the report.
Where possible, we include the MITRE ATT&CK designation for each technique we discuss. We’ve expanded all the ATT&CK references in this report in an appendix at the end, with notes on potential mitigations for each.
The Findings
Credentials: Consequential, the differential, and with influential threat potential
One aspect of incident response investigations is finding out how the attacks started. When classifying the data, we not only note the initial access method (that is, how attackers got into the network) but we attempt to attribute their success to a root cause (why it worked).
In this reporting period, External Remote Services (T1133) topped the list of initial access techniques followed by Exploit Public-Facing Application (T1190). In 70% of cases, abuse of Valid Accounts (T1078) was paired with abuse of External Remote Services. This makes sense, since valid accounts are often required for initial access through a remote service. However, in many cases exploiting a vulnerability allows attackers to use a remote service for initial access, such as when attackers exploit firewalls or VPN gateways.
In past case data, vulnerability exploitation has featured most prominently in the root causes of attacks, followed closely by compromised credentials. The latest case data emphatically reverses that trend, and for the first time, compromised credentials took the top spot in root causes. In the first six months of 2023, compromised credentials accounted for 50% of root causes, whereas exploiting a vulnerability came in at 23%. We can’t conclusively say that attackers are favoring compromised credentials over vulnerabilities, but it can’t be denied that acquiring valid accounts (T1078) makes the job a lot easier for attackers. (And diligent patching makes it harder, as we discussed in the April report and will touch on again below.)
What makes credential compromise even easier is the lack of multifactor authentication (MFA) that persists in many organizations. For example, we were able to identify that MFA was not configured in 39% of cases we’ve investigated so far in 2023. What’s most disheartening about this statistic is that we as an industry know how to solve this problem, yet too few organizations are prioritizing this. Implementing and enforcing phishing-resistant authentication should be a priority for any organization wishing to protect against all attackers, from script kiddies to well-resourced criminal gangs. How detrimental is MFA to attacker achievement on objectives? As we were analyzing the data for this report, we learned that one of the very latest social-engineering tactics seen in the wild is texting to encourage the recipient to disable their Yubikey.
Hardware authentication such as Yubikey offers is not the only game in town; MFA’s maturity ensures that a range of options are available, and Microsoft is doing an arguably decent job of making the process easy. Putting it bluntly, phishing-resistant MFA, coupled with user training in how to use it, is at this point table stakes for staying out of trouble.
In addition, many authentication systems can be configured for adaptive access. Adaptive access changes the level of access or trust based on contextual data about the user or device requesting access. It also limits access to only users that really need it. With adaptive-access authentication systems, you can tailor access policies for specific applications or user groups, and dynamically respond to suspicious signals.
When analyzing the data, we often seek to validate our findings with what others are seeing. In a recent publication, the U.S. Cybersecurity and Infrastructure Security Agency (CISA) found that over half (54%) of initial access was due to compromised credentials, whereas exploits were responsible for only 1% of all attacks studied during the federal government’s fiscal year 2022.
Patches: Tired of waiting for you
While we recognize that CISA deals with a unique set of constituents and attackers, their data still provides an informative general view into how attackers operate. One reason the compromised-credential metric might be high in CISA’s data set might be due to Binding Operational Directive 19-02, which states:
- Critical vulnerabilities must be remediated within 15 calendar days of initial detection
- High vulnerabilities must be remediated within 30 calendar days of initial detection
Which, if true, means that we can force attackers into a narrower set of techniques when we take away some of the low-hanging fruit. Putting it another way: Patching matters.
In our previous report covering 2022, we saw that over half (55%) of all exploited vulnerabilities in our investigations were caused by two vulnerabilities: ProxyShell and Log4Shell — two vulnerabilities with existing patches at the time of compromise. Thankfully there were no Log4Shell exploits seen this time around, but ProxyShell still persists in our 2023 data. In the data we also saw five cases with vulnerabilities from 2021 (this includes the aforementioned ProxyShell cases), three incidents involving the 2020 ZeroLogon vulnerability, and two instances of vulnerabilities from 2019. These were not low-profile or niche vulnerabilities; they were not unpatched (though, admittedly, it took a few tries to get certain patches right); defenders were not unaware of the potential these specific vulns held. It’s hard to see how failing to address n-day vulnerabilities such as these isn’t simply negligence.
A couple of examples illustrate the problem. Of the CVEs assigned in 2022, we saw two exploits of a Zoho ManageEngine (CVE-2022-47966) flaw and one ProxyNotShell (CVE-2022-41080, -41082) sample. On the surface, this may not seem like a big deal. However, for the Zoho vulnerabilities, the advisory was published on January 10, 2023, though the patch had been available since October 28, 2022 – 74 days. A public proof of concept (POC) was released on January 17 and we saw the attacks on January 18 and January 20. Therefore, the patch had been available 82 days before the first attack took place. In the ProxyNotShell case, the advisory was published on September 30, 2022, a patch was made available on November 8, and the attack started on May 19, 2023. That leaves a patching gap of 192 days. It’s not like the public wasn’t warned – warned on this very site, even.
To celebrate better practices, of the several high-profile vulnerabilities in 2023 we spotted three attacks abusing the 3CX vulnerability and two leveraging the PaperCut vulnerability. The 3CX attacks all occurred in March, in the same region, and were all discovered on the same day (March 30), which coincides with the company’s security alert. Acting quickly on this intelligence, the affected organizations were able to limit the attacks to short-lived network breaches. In both cases, the PaperCut vulnerabilities were used by ransomware gangs who reacted quickly to the news — 10 and 11 days respectively — before launching their attacks.
Moving along to other observed techniques, a concerning upward trend for 2023 is the increasing use of the Bring Your Own Vulnerable Driver (BYOVD) technique by attackers. This technique was used in 39% of cases where a vulnerability was the root cause, compared to only 12.5% in all of 2022. It was deployed by at least four different attackers, and in pursuit of a variety of distinct end goals: data extortion (1), network breach (1), and ransomware (5).
Despite lower exploit statistics this time around, we can’t ignore the role that vulnerabilities still play in enabling attacks, and why speedy and effective patching will always be a cornerstone of proactive defense. After all, exploiting a vulnerability can provide a highly privileged, fast track into an organization’s network.
Dwell times, they are a-changin’
Dwell time is a metric we’ve been tracking since the very first Active Adversary report. What this metric helps us understand is how much time (or lack thereof) security teams have to detect and respond to incidents. In this reporting period, we saw a continued decline in overall median dwell time, from 10 days in 2022 to 8 days in the first half of 2023. As we stated in the previous report, this can be seen as both good news and bad news. We believe that increased detection capabilities are contributing to this decline, which is good news indeed. In other words, the time to detect (TTD) is falling as more organizations are “shifting left” (aka “pushing left”) and giving themselves more time to respond (TTR). The bad news is that some threat actors have responded by speeding up.
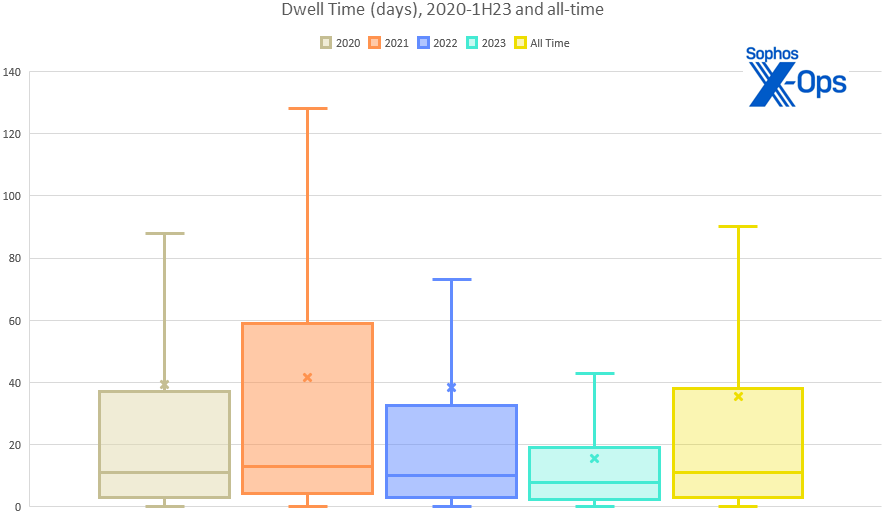
Figure 1: Dwell time (in days) 2020-1H2023, plus the all-time numbers. (New to boxplots? The median value of each year’s data is shown by the horizontal line through each shaded box. The box shows the “middle half” of the numbers [so, all values not in the lower or upper 25% for that year], while the X’s are the mean (average) of all the numbers for that year. The vertical whiskers show the minimum (Q1 – 1.5*IQR [interquartile range, the “middle half” mentioned above]) and maximum (Q3 + 1.5*IQR) values in the data — in this case, the minimum value for all five datasets is zero. Certain outlying cases were excluded in favor of chart readability.)
Looking closer at the details, we can see where this shift is occurring: Notably, it’s the ransomware criminals who are skewing the average. In the first half of 2023, the median dwell time for ransomware incidents has fallen sharply from 9 days to 5 days. In contrast, the median dwell time for all non-ransomware incidents has risen slightly from 11 days to 13 days. So, the ransomware gangs are moving faster than ever, but all other network intrusions, where the motivations and end goals aren’t always clear, tend to linger.
| Dwell Time 1H2023: A Closer Look | |||
| All cases | Ransomware cases | All other cases | |
| Minimum dwell time (days) | 0 | 0 | 0 |
| Maximum dwell time (days) | 112 | 112 | 71 |
| Mean (average) dwell time | 15.57 | 15.35 | 16.04 |
| Median dwell time | 8.00 | 5.00 | 13.00 |
Figure 2: A closer look at 2023’s dwell times
In the previous report, we also looked at when these attacks started and when they were detected. In an effort to improve that analysis, for this edition of the report we translated the latest data set to local time. (Previously, all our data had been presented in log-standard UTC.) Interestingly, when we looked at the data from this new perspective, we saw fresh patterns emerge.
First, the data suggests that 61% of attacks are clustered in the middle of the work week. This pattern held true when isolating ransomware attacks, where 62% occurred mid-week.
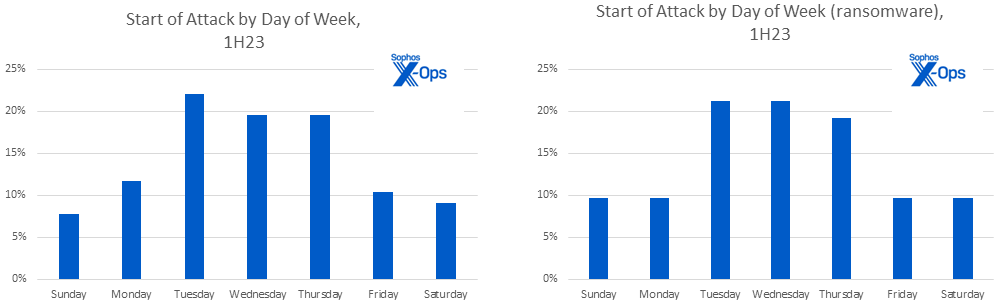
Figure 3: A case of the Mondays? No — the data indicates most attacks commence midweek
We also saw a steady increase in the number of attacks being detected as the week progressed. Ransomware attacks showed a noticeable spike on Fridays and nearly half (43%) of ransomware attacks were launched on either Friday or Saturday.
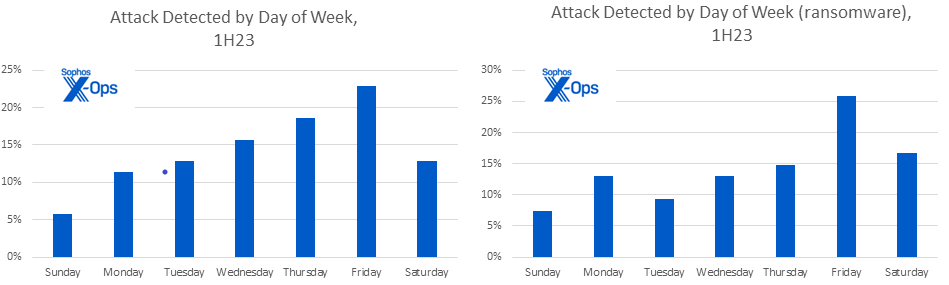
Figure 4: Ransom gangs may show a preference for attacking at the end of the week – often complicating necessary efforts to reach out to not only tech teams but business leadership. We qualify this as a mid-confidence finding since it is also likely that some portion of the cases we saw were actually detected in-house earlier in the week and only revealed to X-Ops incident responders later
Next, the data revealed something new and unpleasant when we analyzed the time of day at which these ransomware attacks were being deployed. (We focused on ransomware attacks because they have the most reliable and objective indicators.)
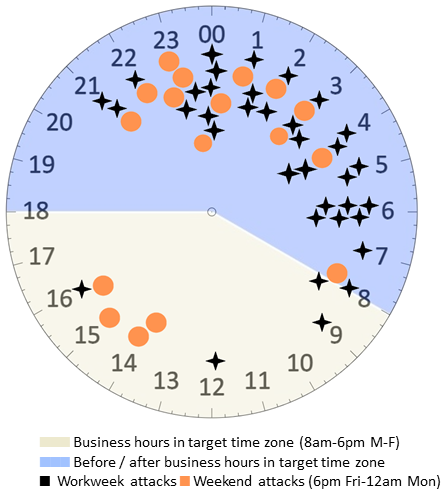
Figure 5: It’s 11pm on a Friday night – where are your incident responders? The late hour at the end of the week was strongly favored for launching ransomware attacks. Note that just 5 of the 53 attacks represented in this chart occurred between the hours of 8am and 6pm on a weekday, with three of those five occurring between 8am and 9am
Most (91%) ransomware payloads are deployed outside of traditional business hours. Digging in a bit deeper, we also observed that of the attacks that did occur during local business hours, only five happened on a weekday.
Active Adversary, meet Active Directory
Another data point we gathered (when possible) for this report was the time it took for threat actors to move laterally to an organization’s Active Directory (AD) infrastructure. In a couple of cases attackers were observed accessing the AD infrastructure before the attack had “officially” started. In other cases, we saw the attack begin with a compromise of an AD server, such as when one victim had exposed their AD server to the internet.
What we found is that the median time-to-AD for all attacks was 0.68 days – about 16 hours. It would appear that attackers are making a concerted effort to move laterally to AD servers as quickly as possible, and with good reason. Throughout the course of our investigations we find that most AD servers are only protected with Microsoft Defender, or sometimes not at all. Unfortunately, adversaries have become very adept at disabling Defender. In fact, we’ve seen a steady rise of this technique (T1562, Impair Defenses) being used over the last three Active Adversary Reports. In 2021, this technique was observed in 24% of cases, rising to 36% in 2022, and continuing to rise to 43% in the first half of 2023.
Establishing a foothold on an Active Directory server greatly enhances the capabilities of an attacker. An AD server is typically the most powerful and privileged asset within a network, one that’s capable of controlling identity and policies across an entire organization. Attackers can siphon off highly privileged accounts, create new ones, or disable legitimate ones. They can also use the AD server to deploy their malware from a trusted source. Finally, by disabling protection, the attackers have a nice place to hide while they carry out the rest of their attack.
RDP – Remote Disaster Protocol
In our previous report we briefly touched on Remote Desktop Protocol (RDP) and some of the impacts it has on the ability to facilitate attacks. While there have been some improvements over the years, RDP remains one of the most widely abused tools, and for good reason. RDP comes pre-installed on most Windows operating systems. Combined with the fact that the use of compromised credentials is rampant, and that single-factor authentication is the norm, it’s no mystery why attackers love it.
RDP played a part in an eye-watering 95% of attacks, an increase from 2022 (when it featured in a previous all-time high 88% of attacks). Internal use featured in 93% of cases and external use was seen in 18% of cases. This is against 86% and 22% respectively for 2022.
The way in which attackers used RDP is worth noting. In over three quarters (77%) of incidents involving RDP, the tool was used only for internal access and lateral movement – a significant increase from 65% in 2022.
RDP was used for external access only in just 1% of cases so far in 2023; and just 16% of attacks showed attackers using RDP for both external access and internal movement, down five points from 2022 (when it was 21%).
While the external use of RDP has fluctuated in the past, and the numbers are currently low, the very presence of an RDP port open to the internet at large — a path that can allow an attacker to waltz through the firewall and onward to the internal network — is simply bad risk management, and no amount of system hardening will mitigate it. (We introduced Active Adversary Protection in our own Intercept X project this spring, and that sort of behavior-based protection helps in conjunction with other protection events, but just throwing RDP open and hoping it works out is not a plan of action.) VPNs are not new technology. Modern remote-access solutions exist. Even if a use case can be made in the organization to use RDP internally, and that’s not a small host-configuration problem to handle, there’s no good reason for any organization to permit RDP access to their system from the open internet in 2023.
Impact: Stealing the Network
Now that we’ve examined how the attacks started and some of the timelines involved, we turn our attention to the impact these attacks had on organizations. As we’ve noted in previous reports, ransomware attacks will always be highly represented in IR datasets since those attacks are the most visible and most destructive, and often require the most expert help. This is especially true for organizations that lack the resources required to respond to complex attacks.
This report’s impact data is no different. The MITRE technique called Data Encrypted for Impact (T1486) led the way at 68%, followed by “no impact” at 30%. We caution that, as discussed in the previous Active Adversary Report, MITRE’s list of techniques in the Impact category only covers actions used to disrupt availability or compromise integrity. Business impacts, or impacts beyond the specific attack under examination — data theft, extant malware (e.g., dropper trojans), web shells, regulatory drama, or simply having an adversary wandering around inside the network, to name but a few — are beyond the scope of ATT&CK.
In many cases we also see secondary impacts. For example, the Inhibit System Recovery technique (T1490) was present in 18% of cases, mostly coupled with ransomware attacks. Inhibit System Recovery tactics can include corruption of backups; disabling of Windows Recovery Environment (WinRE) options or other Windows recovery features; or deletion of crucial recovery tools such as firmware backups, versioning or backup policies, or volume shadow copies. It all complicates recovery, adds to the chaos and confusion of an exfiltration, and strengthens attackers’ hands when ransom (or other) negotiations begin.
Our 2023 data indicates that in 43.4 percent of the cases we saw, data was definitely exfiltrated. The picture gets a bit foggier from there, but only in 9.2 percent of the data could we say that data was definitely not exfiltrated. That’s up from 1.3 percent in 2022, but the odds are still not in your favor.
| Data Exfiltration Detected | ||
| 2022 | 1H23 | |
| Yes | 42.76% | 43.42% |
| No evidence | 42.76% | 31.58% |
| No | 1.32% | 9.21% |
| Unknown | 3.29% | 5.26% |
| Staging | 3.29% | 5.26% |
| Possible | 5.26% | 5.26% |
Figure 6: Even when comparing half-year results for 2023 against full-year results for 2022, provable exfiltration percentages remain all too high
Aside from making yet another case for better logging maintenance and protection, this means that nearly 90 percent of data was either taken, in the process of being taken, possibly taken, or taken and who knows what happened next. This level of uncertainty makes executives and regulators uncomfortable. With the SEC’s long-awaited final rule on Cybersecurity Risk Management, Strategy, Governance, and Incident Disclosure set to take effect for publicly traded US companies in early September, tech leaders are reminded that business leaders are apt to be exquisitely sensitive to mandatory reporting deadlines for incidents that might be deemed “material.” Active Adversary Report is not a lawyer, but as a rule of thumb, while network breaches are important and should be reported (or at least recorded), stolen data is often what makes an attack “material.”
What happens to data after exfiltration? Once an attacker has the data in hand, they’re moving quickly – and setting the pace of what follows. Sophos data so far in 2023 indicates that the median time between exfiltration to ransomware deployment is just 0.88 days – a little over 21 hours. The window from exfiltration to public posting of exfiltrated data was longer but no less depressing, with a median timeframe of 28.5 days. This tracks with the overall trend to shorter and shorter timeframes.
Best Of The Rest
In the spirit of completeness, the following is a summary of the remaining data from this reporting period. As one might expect, a six-month interval doesn’t necessarily deliver sea changes, even in a 2023 landscape that is moving at near-ludicrous speed.
Attack types
Leading the way at a steady 69%, ransomware attacks have remained the most prevalent attack type in our dataset — unsurprising, given that we are working with an IR dataset. Non-specific network breaches came in second at 16% of all attacks. Data extortion rounded out the top three at 9%, nearly tripling its share from 2022 so far. As more groups experiment with extortion-only attacks, we should expect this number to continue growing. For example, in January 2023 the BianLian group was reported as having exclusively switched to an exfiltration-based extortion model; that group represents 86% of all data extortion attacks in our dataset.
| Attack Types Detected | ||
| 2022 | 1H2023 | |
| Ransomware | 68.42% | 68.75% |
| Network Breach | 18.42% | 16.25% |
| Data Extortion | 3.29% | 8.75% |
| Data Exfiltration | 3.29% | 2.50% |
| Web Shell | 2.63% | 1.25% |
| DDoS | — | 1.25% |
| Loader | 3.29% | 1.25% |
Figure 7: Attack categories shift a bit in the lower reaches of the chart, but ransomware continues to rule the attack-type roost
Attribution
As we have done in all previous reports, we publish a leaderboard of the most active ransomware groups in our dataset. In the first six months of 2023, of the 55 ransomware cases investigated, LockBit retained the top spot with 15% of the cases handled, followed closely by BlackCat (13%); Royal (11%); and a three-way tie between Play, Black Basta, and CryTOX (7%) rounds out the top 5. When looking at unique active groups, we found 24 active ransomware gangs so far in 2023, versus 2022’s 33.
Despite LockBit’s prolific presence, Conti still retains the top spot on our all-time list of ransomware groups. However, that will likely change once we tally 2023’s full-year results, with LockBit still coming on strong as it is. But Conti’s legacy is secure, with related / descendant groups like Royal, Black Basta, BlackByte, and Karakurt collectively responsible for 21% of ransomware and data extortion attacks so far in 2023.
Interestingly, cases connected to the 2023-famous Clop group (GoAnywhere, PaperCut, MOVEit) don’t factor heavily in Sophos incident-response data so far in 2023, possibly because of low overlap between Clop’s preferred targets and the Sophos customer base. Also MIA from their top-five showing in 2022: Hive, Phobos, and Conti.
| Most Active Ransomware Groups | ||
| 2022 | 1H2023 | |
| LockBit | 15.38% | 14.55% |
| AlphaVM/BlackCat | 12.50% | 12.73% |
| Royal | 3.85% | 10.91% |
| Play | 2.88% | 7.27% |
| CryTOX | .96% | 7.27% |
| Black Basta | .96% | 7.27% |
| Akira | (did not chart) | 5.45% |
Figure 8: As they did last year, LockBit and AlphaVM/BlackCat lead infections so far in 2023, but new names are bubbling just below. Behind the three-way tie for fourth place sits Akira, which made no appearance at all on 2022’s charts
Tools, LOLBins, TTPs
We divide the artifacts (tools and techniques) we track into three categories. The first are tools, which can be either legitimate-but-abused packages, offensive-security kit, or bespoke hacking tools. The second are living-off-the-land binaries (LOLBins) found on most Windows operating systems. The third category is a catch-all of techniques, malware, cloud storage providers, and other difficult-to-categorize artifacts that we identified in our investigations. So far in 2023 we’ve seen 382 unique tools and techniques used by attackers — 139 software tools; 93 LOLBins; and 150 other unique artifacts, which includes various tactics recognized in MITRE’s ATT&CK taxonomy.
For the first time, Netscan (31.25%) narrowly overtook Cobalt Strike (30%) as the most abused tool. This was followed by mimikatz (28.75%) and AnyDesk (25%). In keeping with their predominance in previous reports, remote access tools made up one-third of the top 15 tools.
| Most Frequently Observed Tools | ||
| 2022 | 1H2023 | |
| Netscan | (did not chart) | 31.25% |
| Cobalt Strike | 42.76% | 30.00% |
| Mimikatz | 28.29% | 28.75% |
| AnyDesk | 30.26% | 25.00% |
| Python | 7.24% | 18.75% |
Figure 9: Netscan, barely a blip in the findings in years past, is the most frequently observed tool in 2023’s findings. Since more than one tool can be used, totals add up to over 100 percent
Looking into LOLBins, Powershell (78.75%) and cmd.exe (51.25%) retained their leading positions, but net.exe (41.25%) and Task Scheduler (40%) swapped spots while climbing the ranks, and PsExec (32.50%) dropped to fifth place overall.
| Most Frequently Observed LOLBins | ||
| 2022 | 1H2023 | |
| PowerShell | 74.34% | 78.75% |
| cmd.exe | 50.00% | 51.25% |
| net.exe | 27.63% | 41.25% |
| Task Scheduler | 28.29% | 40.00% |
| PsExec | 44.08% | 32.50% |
Figure 10: The order changes, but the top five LOLBins so far remain the same from 2022 to 2023. Since more than one LOLBin can be used, totals add up to over 100 percent
With root causes dominated by compromised credentials, it comes as no surprise that the Valid Accounts technique (T1078, 85%) dominates the catchall “other” category. In second place was System Services: Service Execution (aka installing a service, T1569.002, 56.25%); Command and Scripting Interpreter (aka executing a malicious script, T1059, 50.00%), File and Directory Discovery (aka browsing the network, T1083, 47.50%), and Impair Defenses (aka disabling protections, T1562, 32.50%) round out the top five.
| Most Frequently Observed “Other” | ||
| 2022 | 1H2023 | |
| Valid accounts | 71.05% | 85.00% |
| Install service | 63.82% | 56.25% |
| Malicious scripts | 53.29% | 50.00% |
| Browse networks | 43.42% | 47.50% |
| Disable protection | 36.18% | 42.50% |
Figure 11: The rankings for the catchall “other” category remain unchanged between 2022 and 2023. (Beyond the percentages shown, we’ve noticed “MFA unavailable” making a remarkable seventh-place showing, outpacing even popular maneuvers such as “modify registry,” but it remains to be seen how that plays out for the rest of 2023.) Since more than one finding can be found, totals add up to over 100 percent
Conclusion
As it is often said, at its core, infosec is about managing risk. The information presented in this report lays bare some of the ways attackers introduce risk to organizations. Tech leaders are given strategic direction and a budget with which to operationalize the strategy and manage those risks. For many tech leaders, the budget will never be sufficient and prioritizing resources will inevitably inform how those resources are deployed. The good news is reducing the risks posed by attackers is possible. Not only is it possible, but some mitigations will have a massive positive impact on the organizations that choose to implement them.
Some mitigations will require a change in corporate policy, such as ensuring that comprehensive patching is a priority or mandating that RDP use is necessary, limited, and audited. Others may require new tooling, such as investing in and implementing phishing-resistant MFA everywhere or ensuring that proper telemetry is available when needed.
Securing RDP, while not trivial, should be a priority for security teams, and one that will likely have a noticeable impact. If, for example, attackers are forced to either break MFA or import their own remote access tools into the environment (two activities that should raise alarms in the SOC), the very act of throwing up a no-RDP-access roadblock will cause an attacker to expend time and effort. And, as our numbers show, anything defenders can do to get time on their side is a wise choice.
Having complete telemetry is no longer a nice-to-have. The corporate mandate to both store the data for a sensible amount of time and to actually look at it periodically is crucial, both to addressing active adversaries before things spiral into their control (and out of yours) and — when crisis comes — to quickly and reliably give defenders, whether your own or from outside your organization, the tools they need to rapidly assess, identify, and respond to cases. Best practice means both gathering the data and having eyes on it, either inside your organization or at a trusted service provider. If your first indication of trouble is receipt of a ransom note, you’re doing it wrong.
Better cybersecurity outcomes are possible, and tech leaders are the ones that can turn a possibility into a reality. It has to start somewhere, it has to start sometime. What better place than here, what better time than now?
Appendix A: Demographics and Methodology
For this report, 88% of the dataset was derived from organizations with fewer than 1000 employees. As in previous years, greater than 50% of organizations requiring our assistance have 250 employees or fewer. For a detailed look at our demographics for years prior to 2023, please refer to the 2023 Active Adversary Report for Business Leaders, published earlier this year.
As we put together this report, we analyzed up to 80 cases that could be meaningfully parsed for useful information on the state of the adversary landscape as of the end of June 2023. Protecting the confidential relationship between Sophos and our customers is of course our first priority, and the data you see here has been vetted at multiple stages during this process to ensure that no single customer is identifiable through this data – and that no single customer’s data skews the aggregate inappropriately. When in doubt about a specific case, we excluded that customer’s data from the dataset.
Nations represented (2023 data only)
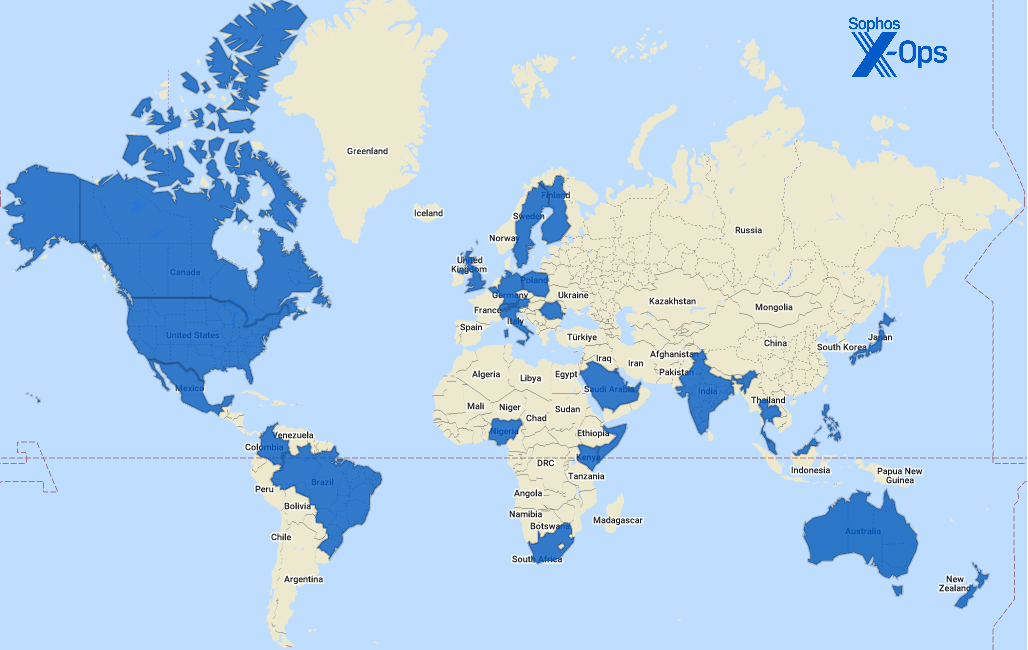
Figure 12: The thirty-four countries we’ve visited (virtually or otherwise) so far in 2023
| Australia | Japan | Singapore |
| Austria | Kenya | Somalia |
| Bahrain | Kuwait | South Africa |
| Belgium | Malaysia | Spain |
| Brazil | Mexico | Sweden |
| Canada | New Zealand | Switzerland |
| Colombia | Nigeria | Thailand |
| Finland | Philippines | United Arab Emirates |
| Germany | Poland | United Kingdom of Great Britain and Northern Ireland |
| Hong Kong | Qatar | |
| India | Romania | United States of America |
| Italy | Saudi Arabia |
Industries represented (2023 data only)
| Architecture | Government | News Media |
| Communication | Healthcare | Non-profit |
| Construction | Hospitality | Pharmaceutical |
| Education | Information Technology | Real estate |
| Electronics | Legal | Retail |
| Energy | Logistics | Services |
| Entertainment | Manufacturing | Transportation |
| Financial | Mining | |
| Food | MSP/Hosting |
Methodology
The data in this report was captured over the course of individual investigations undertaken by Sophos’ X-Ops Incident Response team.
In the discussion of attacks by time of day, for each case we treated “local time” as the time zone at the customer’s functional headquarters. In the case of enterprises operating in multiple locations such that a single “local” time zone could not be conclusively identified (e.g., companies with multiple significant locations across the United States), we assigned a time zone based on country location and population density. In the United Stated, for instance, we treated US Central Time (UTC -6) as the “local” zone for cases in which a specific local time zone could not be adequately determined.
When data was unclear or unavailable, the author worked with individual IR case leads to clear up questions or confusion. Incidents that could not be clarified sufficiently for the purpose of the report, or about which we concluded that inclusion risked exposure or other potential harm to the Sophos-client relationship, were set aside. We then examined each remaining case’s timeline to gain further clarity on such matters as initial access, dwell time, exfiltration, and so forth. We retained 80 cases, and those are the foundation of the report.
Appendix B: MITRE ATT&CK Techniques Listed in This Report
This appendix lists the ATT&CK techniques and sub-techniques mentioned in this report, with information on potential mitigations for each.
| Leading MITRE ATT&CK findings in Active Adversary data, 1H2023 | ||
| Technique | Name | Notes |
| T1059 | Command and Scripting Interpreter | Abuse of command or script interpreters, part of the Execution stage of the ATT&CK chain, comes in a variety of forms; MITRE lists nine subtechniques under this umbrella. Potential mitigations include M1021 (Restrict Web-Based Content), M1026 (Privileged Account Management), M1038 (Execution Prevention), M1040 (Behavior Prevention on Endpoint), M1042 (Disable or Remove Program or Feature), M1045 (Code Signing), and M1049 (Antivirus/Antimalware). |
| T1078 | Valid Accounts | With four subtechniques and an equal number of appearances in ATT&CK chain stages (Initial Access, Defense Evasion, Persistence, Privilege Escalation), traces of this technique can be a defender’s first indication of trouble. Potential mitigations include M1013 (Application Developer Guidance), M1015 (Active Directory Configuration), M1017 (User Training), M1018 (User Account Management), M1026 (Privileged Account Management), M1027 (Password Policies), and M1036 (Account Use Policies). |
| T1083 | File and Directory Discovery | This tactic, part of the larger Discovery step in the ATT&Ck chain, has no subtechniques; whether adversaries enumerate files and directories search in specific host or network-share locations, it’s all the same. MITRE lists no mitigative controls at all for this technique, since it relies on the abuse of legitimate system features by illegitimate entities. |
| T1133 | External Remote Services | This technique, part of both initial-access and persistence maneuvers, has no subtechniques but a long list of threat actors who rely on it. Potential mitigations include M1030 (Network Segmentation), M1032 (Multifactor Authentication), M1035 (Limit Access to Resources over Network), and M1042 (Disable or Remove Feature or Program). |
| T1190 | Exploit Public-Facing Application | This is when an attack exploits a vulnerability in an external-facing application. (If little Bobby Tables grew up and got a car with a vanity license plate, it would say T1190.) Potential mitigations include M1016 (Vulnerability Scanning), M1026 (Privileged Account Management), M1030 (Network Segmentation), M1048 (Application Isolation and Sandboxing), M1050 (Network Segmentation), and M1051 (Update Software) |
| T1486 | Data Encrypted for Impact | This availability-impairing technique, which covers adversaries encrypting data on target systems or simply systems on the network, has no sub-techniques. Potential mitigations include M1040 (Behavior Prevention on Endpoint) and M1053 (Data Backup). |
| T1490 | Inhibit System Recovery | There are no sub-techniques to this, which describes attackers’ choices to delete system features or turn off services designed to aid in recovery. (Not to be confused with T1562, below). Potential mitigations include M1018 (User Account Management), M1028 (Operating System Configuration), and M1053 (Data Backup). |
| T1562 | Impair Defenses | A defense-evasion tactic with ten listed sub-techniques, that can include anything from disabling antimalware protections to blowing away logs. Potential mitigations include M1018 (User Account Management), M1022 (Restrict File and Directory Permissions), M1024 (Restrict Registry permissions), M1038 (Execution Prevention), and M1047 (Audit). |
| T1569.002 | System Services: Service Execution | One of two sub-techniques of System Services (T1569), this is an execution technique abusing the Windows service control manager (SCM); Cobalt Strike can also use PsExec to do this. Potential mitigations include M1022 (Restrict File and Directory Permissions), M1026 (Privileges Account Management), and M1040 (Behavior Prevention on Endpoint). |
Michael Cataldo
Interesting article. One thing that isn’t addressed and is a growing problem is professional standards for IT and customer support. There are a lot of seniors who have technology which still plays a large role in their lives. However they can no longer afford the time, and expense of maintaining current levels of security. At the consumer level the local “nerdsRus” style shop cannot help them or at best sells them useless help. At a recent conference with people who run virtual grids in Opensimulator, most of the people running large complicated grids were in their late 50s, 60s and one gentleman in his 70s. Each of these networked grids has anywhere from 20-100 users who daily put personal information up where it will be vulnerable. Might be interesting look into something like this in the future.
N. Bassett-Jones
A very useful report