The 4624_4625 login events query provides defenders, specifically analysts, with a useful tool for both identifying successful RDP logins (Windows Security Log Event 4624) and failed attempts (Windows Security Log Event 4625). These events can be generated by systems, domain controllers, and workstations.
These Windows events are visible in Event Viewer, of course, but in this post (and in the companion video we’ve put on our YouTube channel) we’ll demonstrate our analysis using Sophos Central. The SQL query we’ll use below is available to all on our Github.
Building and executing the query
The SQL query we’ll be working with looks like this:
SELECT
strftime('%Y-%m-%dT%H:%M:%SZ',datetime) AS date_time,
eventid AS EventID,
CASE
WHEN eventid = 4624 THEN eventid || ' - Successful Login'
WHEN eventid = 4625 THEN eventid || ' - Failed login'
END AS Description,
'Security' AS Source,
JSON_EXTRACT(data, '$.EventData.TargetUserName') AS Target_User,
JSON_EXTRACT(data, '$.EventData.WorkstationName') AS Source_Machine_Network,
JSON_EXTRACT(data, '$.EventData.IpAddress') AS Source_IP,
JSON_EXTRACT(data, '$.EventData.ProcessName') AS Process_Name,
JSON_EXTRACT(data, '$.EventData.LogonType') AS Logon_Type,
JSON_EXTRACT(data, '$.EventData.TargetUserSid') AS Target_User_SID,
JSON_EXTRACT(data, '$.EventData.Status') AS Logon_Status_Code,
JSON_EXTRACT(data, '$.EventData.TargetDomainName') AS Target_Domain_Name,
JSON_EXTRACT(data, '$.EventData.AuthenticationPackageName') AS Authentication_package,
NULL AS SessionID,
NULL AS Session_ID,
'Security EVTX' AS Data_Source,
'Logins.01.1' AS Query
FROM sophos_windows_events
WHERE source = 'Security'
AND (eventid = 4624 OR eventid = 4625)
AND JSON_EXTRACT(data, '$.EventData.TargetUserName') LIKE '$$username$$'
AND JSON_EXTRACT(data, '$.EventData.IpAddress') LIKE '$$source_ip$$'
AND JSON_EXTRACT(data, '$.EventData.WorkstationName') LIKE '$$workstation$$'
AND time > 0
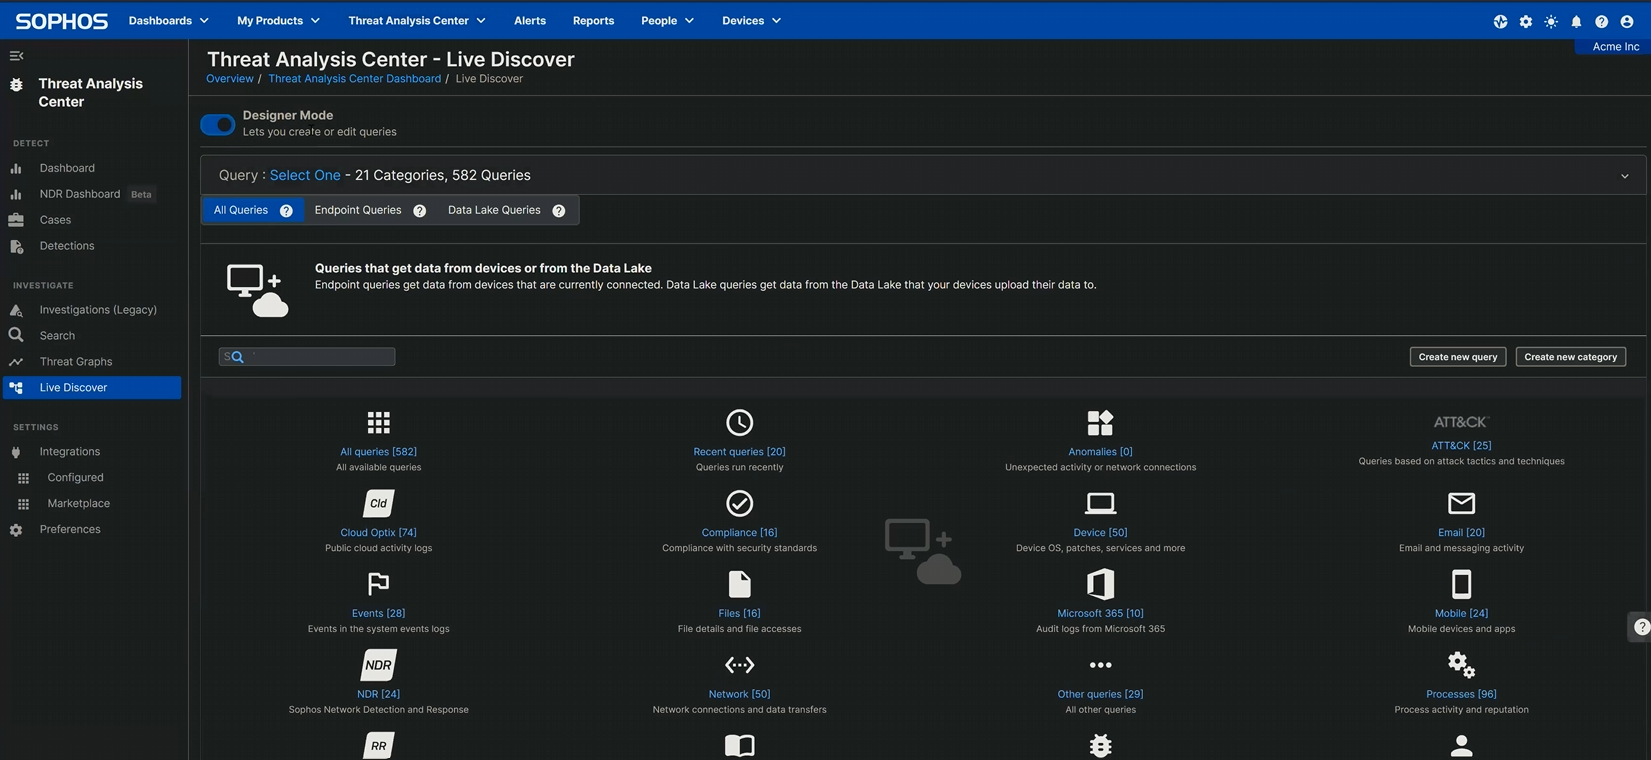
To execute this in Sophos Central, navigate to
Threat Analysis Center > Live Discover > Designer Mode
and click the Create new query button, as shown in Figure 1.
Figure 1: Creating a query on the Designer Mode screen; the Create new query button is on the right near the middle of the screen
Clicking the button leads to a screen with a SQL box, into which you’ll paste the query.
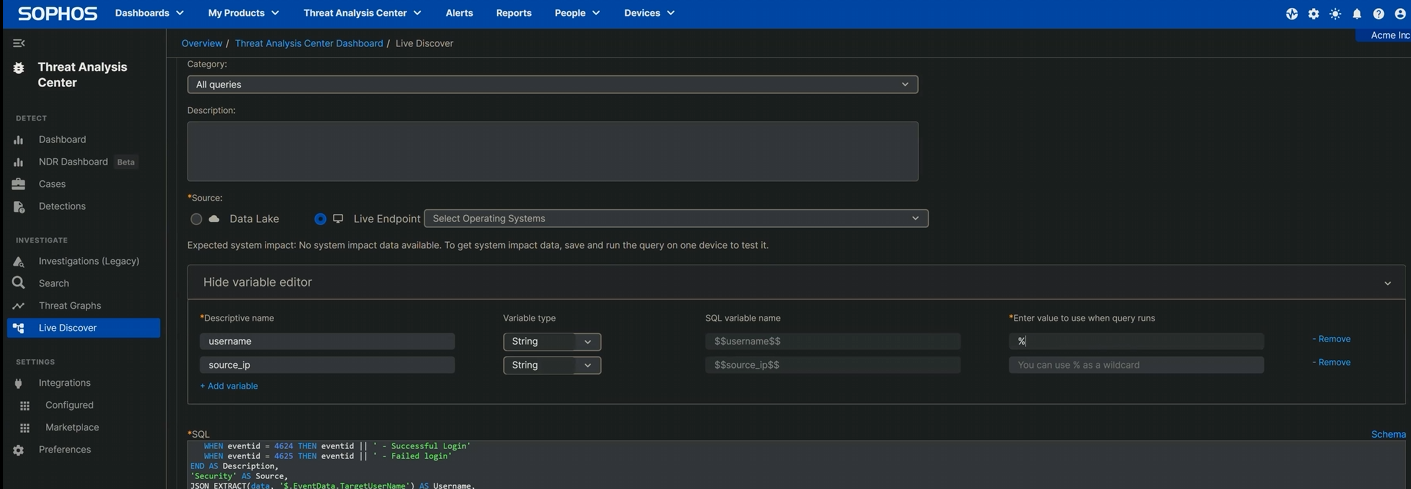
Note that this query has two variables – one for the targeted username(s) (username) and one for the IP address of the entity attempting access (source_ip). Both of these are strings; to ensure the query returns the greatest possible number of results, these should include wildcards for those variables. (When our Incident Response investigators use this in the course of their work, as a rule they run it against every Windows device on the network; the first time you run it and occasionally thereafter, consider doing the same to get the broadest possible view of what’s happening on your network.)
To do that, edit these two variables in the Variable Editor just above the box into which the query is pasted. Click Show Variable Editor, then click + Add variable. In the Descriptive name field, type the first variable name (username); the type (String) and SQL variable name ($$username$$) will auto-populate. On the next line, do the same for the second variable ($$source_ip$$). On the right, add the percentage sign (%) that indicates a wildcard, as shown in Figure 2:
Figure 2: The variable editing is nearly complete – one more percentage sign and it’s ready
Next, scroll down to the Filters area and select the machines on which the query should run. (Since this is a Windows event, there’s no point running it on any macOS or Linux machines in your estate, so those should be filtered out.) Clicking the tickbox next to “Online status” (at the top of the column) selects all; click “Update selected devices list” to confirm.
Once the variables and filters are set, click Run Query, and click it again when the system asks if you want to run this untested query. The execution begins; the time to completion will of course depend on the size of your estate, your connection speed, and above all how large the event log is. However, it will eventually conclude, returning a table of results. It is of course possible to review these right in Sophos Central, but it’s also possible (and perhaps a bit more pleasant) to export the whole thing to a CSV file for perusal in your preferred spreadsheet editor.
Understanding the results
However you prefer to view the returned results, a few fields stand out:
| Query Results: An overview | |
| epName | Endpoint name |
| date_time | The UTC-format time at which the event was recorded in the queried log; sorting on date_time can pinpoint bursts of activity at unexpected times |
| EventID | Either the connection succeeded (4624) or it failed (4625) |
| Source | The log in which these query results were found |
| Username | The username offered when the connection was attempted; worth checking for users that shouldn’t be making RDP attempts, as well as for usernames that don’t fit your organization’s “style” (eg., if your org calls the system administration accounts “Administrator,” seeing “ADMINISTRATOR,” “admin,” or the like should get your attention) |
| Source_Machine_Network | The true name of the host that connected (or attempted to connect); a name you don’t recognize or that doesn’t fit the organization’s naming schema is probably worth investigating further |
| Source_IP | The originating IP address; if it’s not coming from inside the estate (that is, if it’s a non-RFC 1819 connection, a remote IP address), it bears scrutiny |
| Logon_Type | Microsoft assigns a dozen codes to different types of logins; in this situation, investigators looking at RDP abuse may note type 3 (network, including post-NLA, logins), type 7 (the workstation was unlocked; if the IP field associated with this event is a remote address, that’s suspicious), or type 10 (remote login using Terminal Servies or, yes, RDP) |
In the table above, we’ve noted a number of potential grounds for further investigation based on the results this query returns; here’s one more. Though this query can spot potential RDP exposure issues, it may spot something else that needs your prompt attention — for instance, SMB.
There is, in the year 2024 (a full seven years since EternalBlue and WannaCry dropped), no good reason to leave a shared folder or drive hanging out on the internet in this fashion – and yet one in five of the cases handled in 2022 and 2023 by the Incident Response team had evidence of SMB abuse. That statistic doesn’t hold a candle to RDP’s cursed dominance in our IR findings, where over 90 percent of the cases include RDP-related findings, but it’s a good reminder that keeping an eye on your organization’s logs with regularly run queries such as this can return some eye-opening results indeed.
Remote Desktop Protocol: The Series
Part 1: Remote Desktop Protocol: Introduction (post, video)
Part 2: Remote Desktop Protocol: Exposed RDP (is dangerous) (post, video)
Part 3: RDP: Queries for Investigation (post, video)
Part 4: RDP Time Zone Bias (post, video)
Part 5: Executing the External RDP Query (post, video)
Part 6: Executing the 4624_4625 Login Query ([you are here], video)
GitHub query repository: SophosRapidResponse/OSQuery
Transcript repository: sophoslabs/video-transcripts
YouTube playlist: Remote Desktop Protocol: The Series


