
In my previous article I laid out the Sophos vision for extended detection and response (XDR) and discussed the concept of ‘the gray zone’. As a quick recap, the gray zone is the potentially suspicious signals that cannot automatically be classified as good or bad and need further investigation in order to determine if they present a threat to the organization. This article explores further the process of taking those detections and working through an investigation to determine whether they are signs of malicious activity using Sophos XDR.
As I explained previously, optimizing prevention is in Sophos’ DNA, and is a key pillar in our XDR strategy. By automatically blocking 99.98% of threats*, Sophos enables your security analysts to focus their limited, valuable time on the detections where they will have the biggest impact.
Minimize the time to detect
Let’s imagine the scenario where an attacker has managed to infiltrate your organization through an unprotected device. Now that they have a foothold, every second counts. Their goal is to run silently and remain unnoticed for as long as possible. As they attempt to raise their privileges or move laterally across your network to other machines, they leave a trail. The breadcrumbs include indicators collected in various event logs, as well as detections logged by a protected device. With Sophos XDR, our goal is to shine a spotlight on these detections, in the most effective manner.
We do this by using multi-vector machine learning and threat intelligence to provide an AI-prioritized risk score for each detection. The scores range from 0 to 10. With 0 being not determined, 1 to 3 representing a low risk, 4 to 7 representing a medium risk, 8 to 9 representing a high risk, and 10 as the highest risk. These scores are then color-coded for severity and mapped against the MITRE ATT@CK framework, enabling an analyst to quickly identify where they should focus.
If an analyst wants to look into in a detection, Sophos XDR gives them contextual information at their fingertips. Operators can access valuable insights such as the first and last time a detection was seen, a description of the detection, device geo-location, LOL-bin use including command lines, parent/child relationships, process name, hash, and other data points.
Analysts can pivot on any of the data points to explore further. For example, the analyst could request a threat graph to see a visual step-by-step recreation of the detection, including processes, files, the registry keys that were touched, and more. Contextual information is not limited to the device; analysts can look up a hash on VirusTotal with a single click or look at failed/successful login attempts for a specific user across your entire estate. These insights provide valuable context to the analyst.
Detections can come from all over your environment: endpoint, server, firewall, email, cloud, mobile, Office 365, and more. The latest addition to the Sophos Data Lake is the ability to import events from Office 365, enabling you to see events from Exchange, SharePoint, OneDrive, Azure Active Directory, PowerBI, Teams, and more. Analysts can correlate between the detections from Sophos products and what is being logged in the Office 365 audit logs. Sophos XDR will also search the Office 365 data for detections, provide a risk score and bring them to the attention of an analyst, in the very same manner as a Sophos product.
The greater your net, the greater your chance of catching a malicious signal before the damage is done. Watch this video for an overview of the Sophos XDR Detections functionality.
The game is afoot
Armed with this detailed understanding of a detection, analysts can then dive deeper, create a case and perform a full investigation. The analyst is the detective, piecing together the clues (detections) from across their environment, taking notes, and chasing down each lead, improving their understanding, until they unmask the root cause and resolve the case.
If a detection is severe enough, the system will automatically correlate and include pertinent signal and detections into a case ready for the analyst’s review. Additionally, pivots and enrichments that are contextual to the detections in the case will be presented. This provides the full picture of what was happening in the environment and saves valuable time for the analyst.
Cases can also be manually created by the analyst when they see a detection that piques their interest. A priority (low, medium, high) can be assigned by the analyst for each of their cases. The cases have different states (Not started, In Progress, On Hold, Archived, Closed), and can be assigned to one or more analysts.
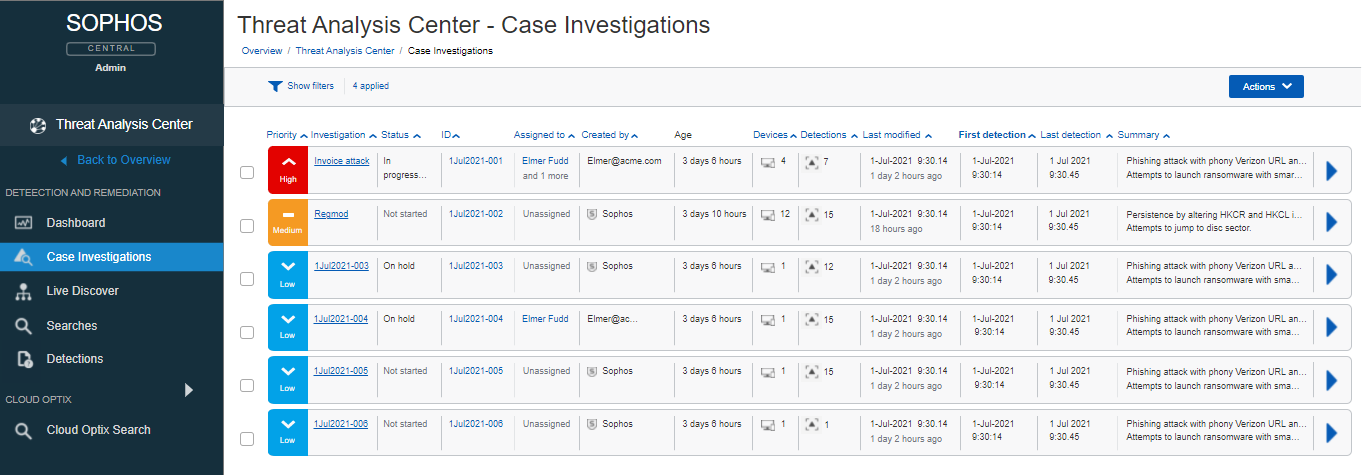
From the Case Investigation Dashboard, an analyst has an overview of every case. Information such as priority, a title, status, assigned analyst(s), who created it, age of the case, number of impacted devices and detections, last modified time, first and last detection times, and a summary.
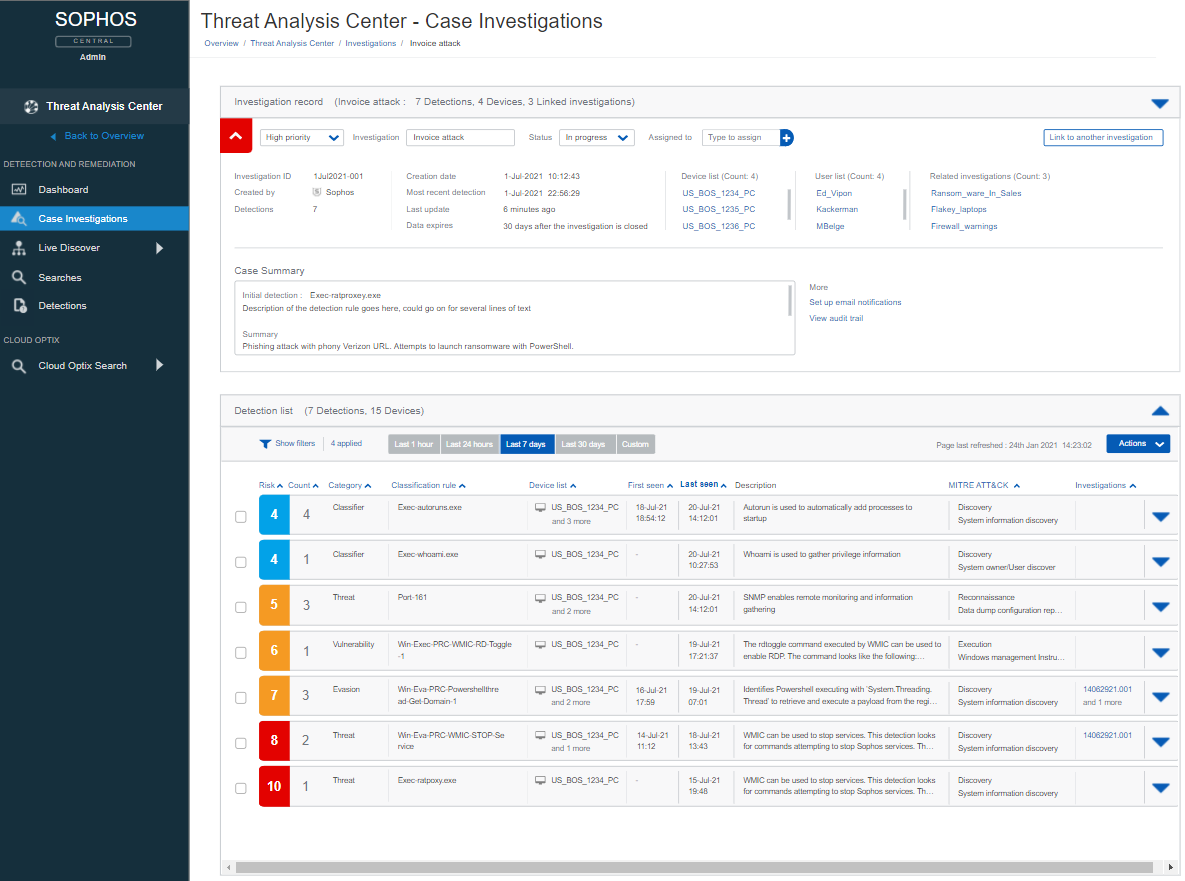
Once an analyst is working on a case they have a wealth of information at their fingertips, allowing them to focus. Detections can be added or removed from a case. The analyst can look at the details of a device, and even establish a Live Response session to take direct action and perform tasks on the impacted device. Could it be that one of the users listed in the case recently had 20 failed login attempts, followed by a successful login?
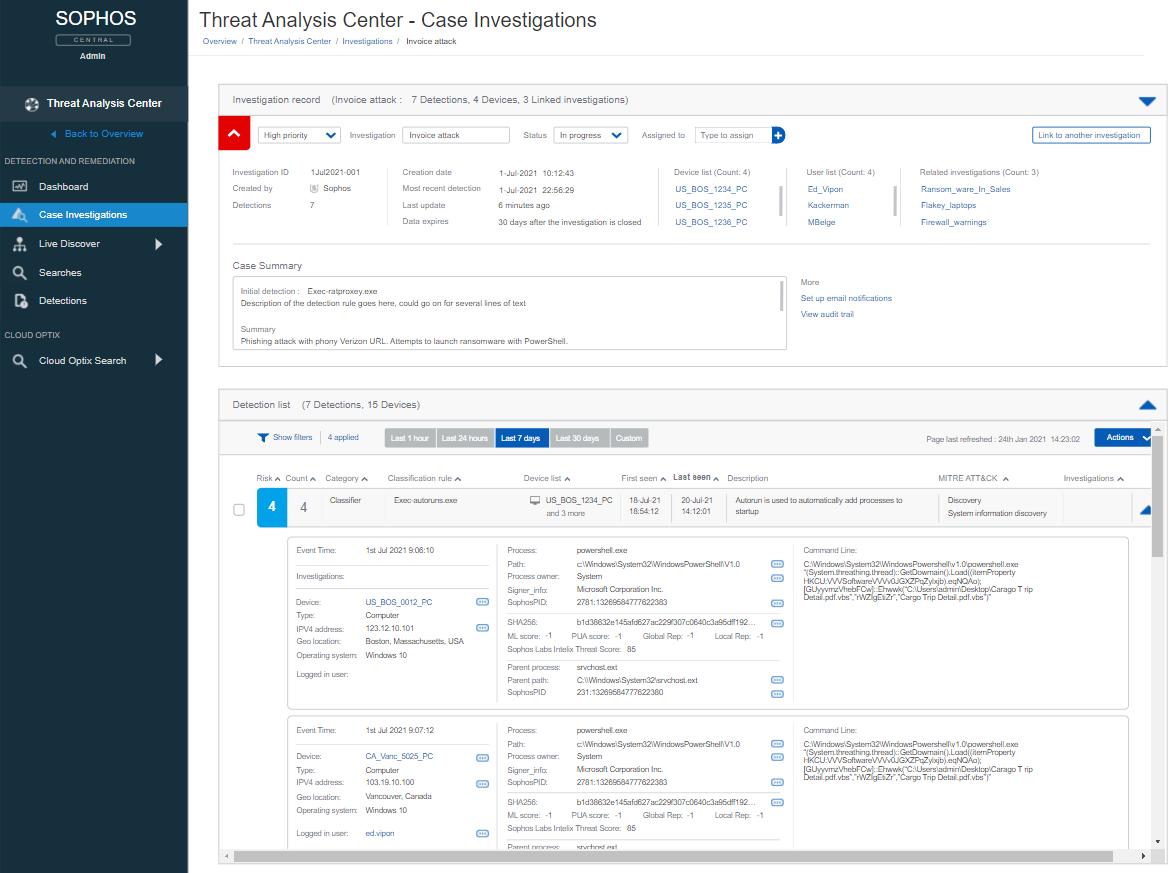
If the analyst wants to look at a specific detection and follow the breadcrumbs, they simply expand the detection, examine the details, or pivot to any other information that may prove valuable to the case.
During their investigation, an analyst can make notes. This could be information of their discoveries or advising other analysts of what tasks they’ve already completed. Case notes are free format and come pre-populated with an investigation template. This template can be used to prompt an analyst on what to investigate. Were there any internal/external IPs, domains, or URLs connected to from the device? Any external RDP/SSH login attempts around the time of the detection? Did the detection identify any listening ports? Was the detection related to autorun or a service? It is an extensive template, built by experienced Sophos threat-hunters, that can coach and remind analysts of potential areas to investigate.
With all of the relevant information at their fingertips, the analyst can follow every lead, see the complete picture, understand the detections and solve the case!
Conclusion
Customers are already on a strong footing with Sophos XDR focusing on optimizing prevention. With less noise, analysts can focus their limited, valuable time and keep their organizations safe. Sophos XDR is enabling Sophos customers of all sizes to optimize their protection and minimize the time to detect, investigate and respond to threats in their organization.
* Source: AV-Test 2021 average score
Leave a Reply