
The first Sophos Active Adversary Report of 2024 presents what the Sophos X-Ops Incident Response (IR) team has learned about the current adversary landscape from tackling security crises around the world. Our report is based on data from over 150 cases drawn from the 2023 workload of the IR team. We provide more detail on the demographics represented in this analysis at the end of the report.
As has been standard for Sophos’ Active Adversary reports, this edition incorporates data from previous years of IR casework, stretching back to the launch of our IR service in 2020. While this report will primarily focus on the analysis of cases investigated by the IR team during 2023, we will also take a longer view of the data, where applicable, to understand any meaningful changes and trends — and, sometimes, the lack thereof.
A second report, to be issued in late summer, will incorporate data from the first half of 2024 – in other words, the cases we are working on right now, and cases that have yet to occur. The eternal battle between attackers and defenders has cycles, inflection points, and currents all its own. Keeping a close eye on those rhythms even when things seem to be oh-so-quiet is key for defenders looking to understand and react.
Key takeaways
- Ransomware levels have reached homeostasis
- Timelines have stabilized
- Tooling is stagnant
- Zero days are not the real problem
- And still, defenses aren’t keeping up
Where the data comes from
For this report, the data for which as always is drawn from the cases tackled by our external-facing Incident Response team, 88% of the dataset was derived from organizations with fewer than 1000 employees. As in previous years, over half (55%) of organizations requiring our assistance have 250 employees or fewer. Twelve percent of the organizations with which IR worked in 2023 were companies with over 1000 employees, down from 19% in 2022. (For a glimpse of data drawn from the combined forces of our IR and MDR teams, but focused on the cohort of customers with 500 employees or fewer, please see our sister publication, the 2024 Sophos Threat Report.)
And what do these organizations do? For a fourth consecutive year, the manufacturing sector (25%) was the most likely to request Sophos IR services, followed by information technology (10%), retail (9%), and services (9%). In total, 26 different sectors are represented in this dataset. Further information on the data and methodology used to select cases for this report can be found in the Appendix.
Editor’s note: Since initial publication, a sentence in the section “Stats #2: To AD or not to AD: Active Directory takes the stage” has been fixed to reflect that mainstream support for Windows Server 2019 ended in January 2024.
Summary of findings
As has become the norm for most incident response-focused reports throughout the industry, ransomware maintained its dominance as the top attack type in 2023, with 70% of investigations resulting from a ransomware attack. While there was some fluctuation on a quarterly basis, ranging from 62% to 80%, we believe that this yearly average is well within the margins of what is likely ransomware’s background rate.
Attack Types
| 2023 Attack Types | Count | % |
| Ransomware | 108 | 70.13% |
| Network breach | 29 | 18.83% |
| Data extortion | 11 | 7.14% |
| Data exfiltration | 2 | 1.30% |
| Business email compromise * | 1 | 0.65% |
| Web shell | 1 | 0.65% |
| Loader | 1 | 0.65% |
| DDoS | 1 | 0.65% |
| Grand Total | 154 | 100.00% |
Figure 1: As in previous years, our Incident Response team conducted more investigations of ransomware cases than of any other type of attack in 2023. However, our data indicates a large number of assessments outside the dataset that conform to Sophos’ definition of business email compromise. Since just one of these assessments resulted in a full investigation, they are lightly represented in the report dataset, but the authors of this report may choose to publish findings concerning those assessments at a later date
Network breach, the perennial bridesmaid, retained its spot with a 19% occurrence rate in 2023. While we can’t be certain in all cases, there is mounting evidence that many network breaches are indeed unsuccessful ransomware attacks. For example, we positively identified five network breaches (17%) that were the work of known ransomware brands. An interesting statistic emerged when comparing network breaches to ransomware attacks by quarter: During the quarters where ransomware was at its lowest prevalence – 67% in Q2 and 62% in Q3 – network breaches were considerably above the yearly average, 21% in Q2 and 28% in Q3.
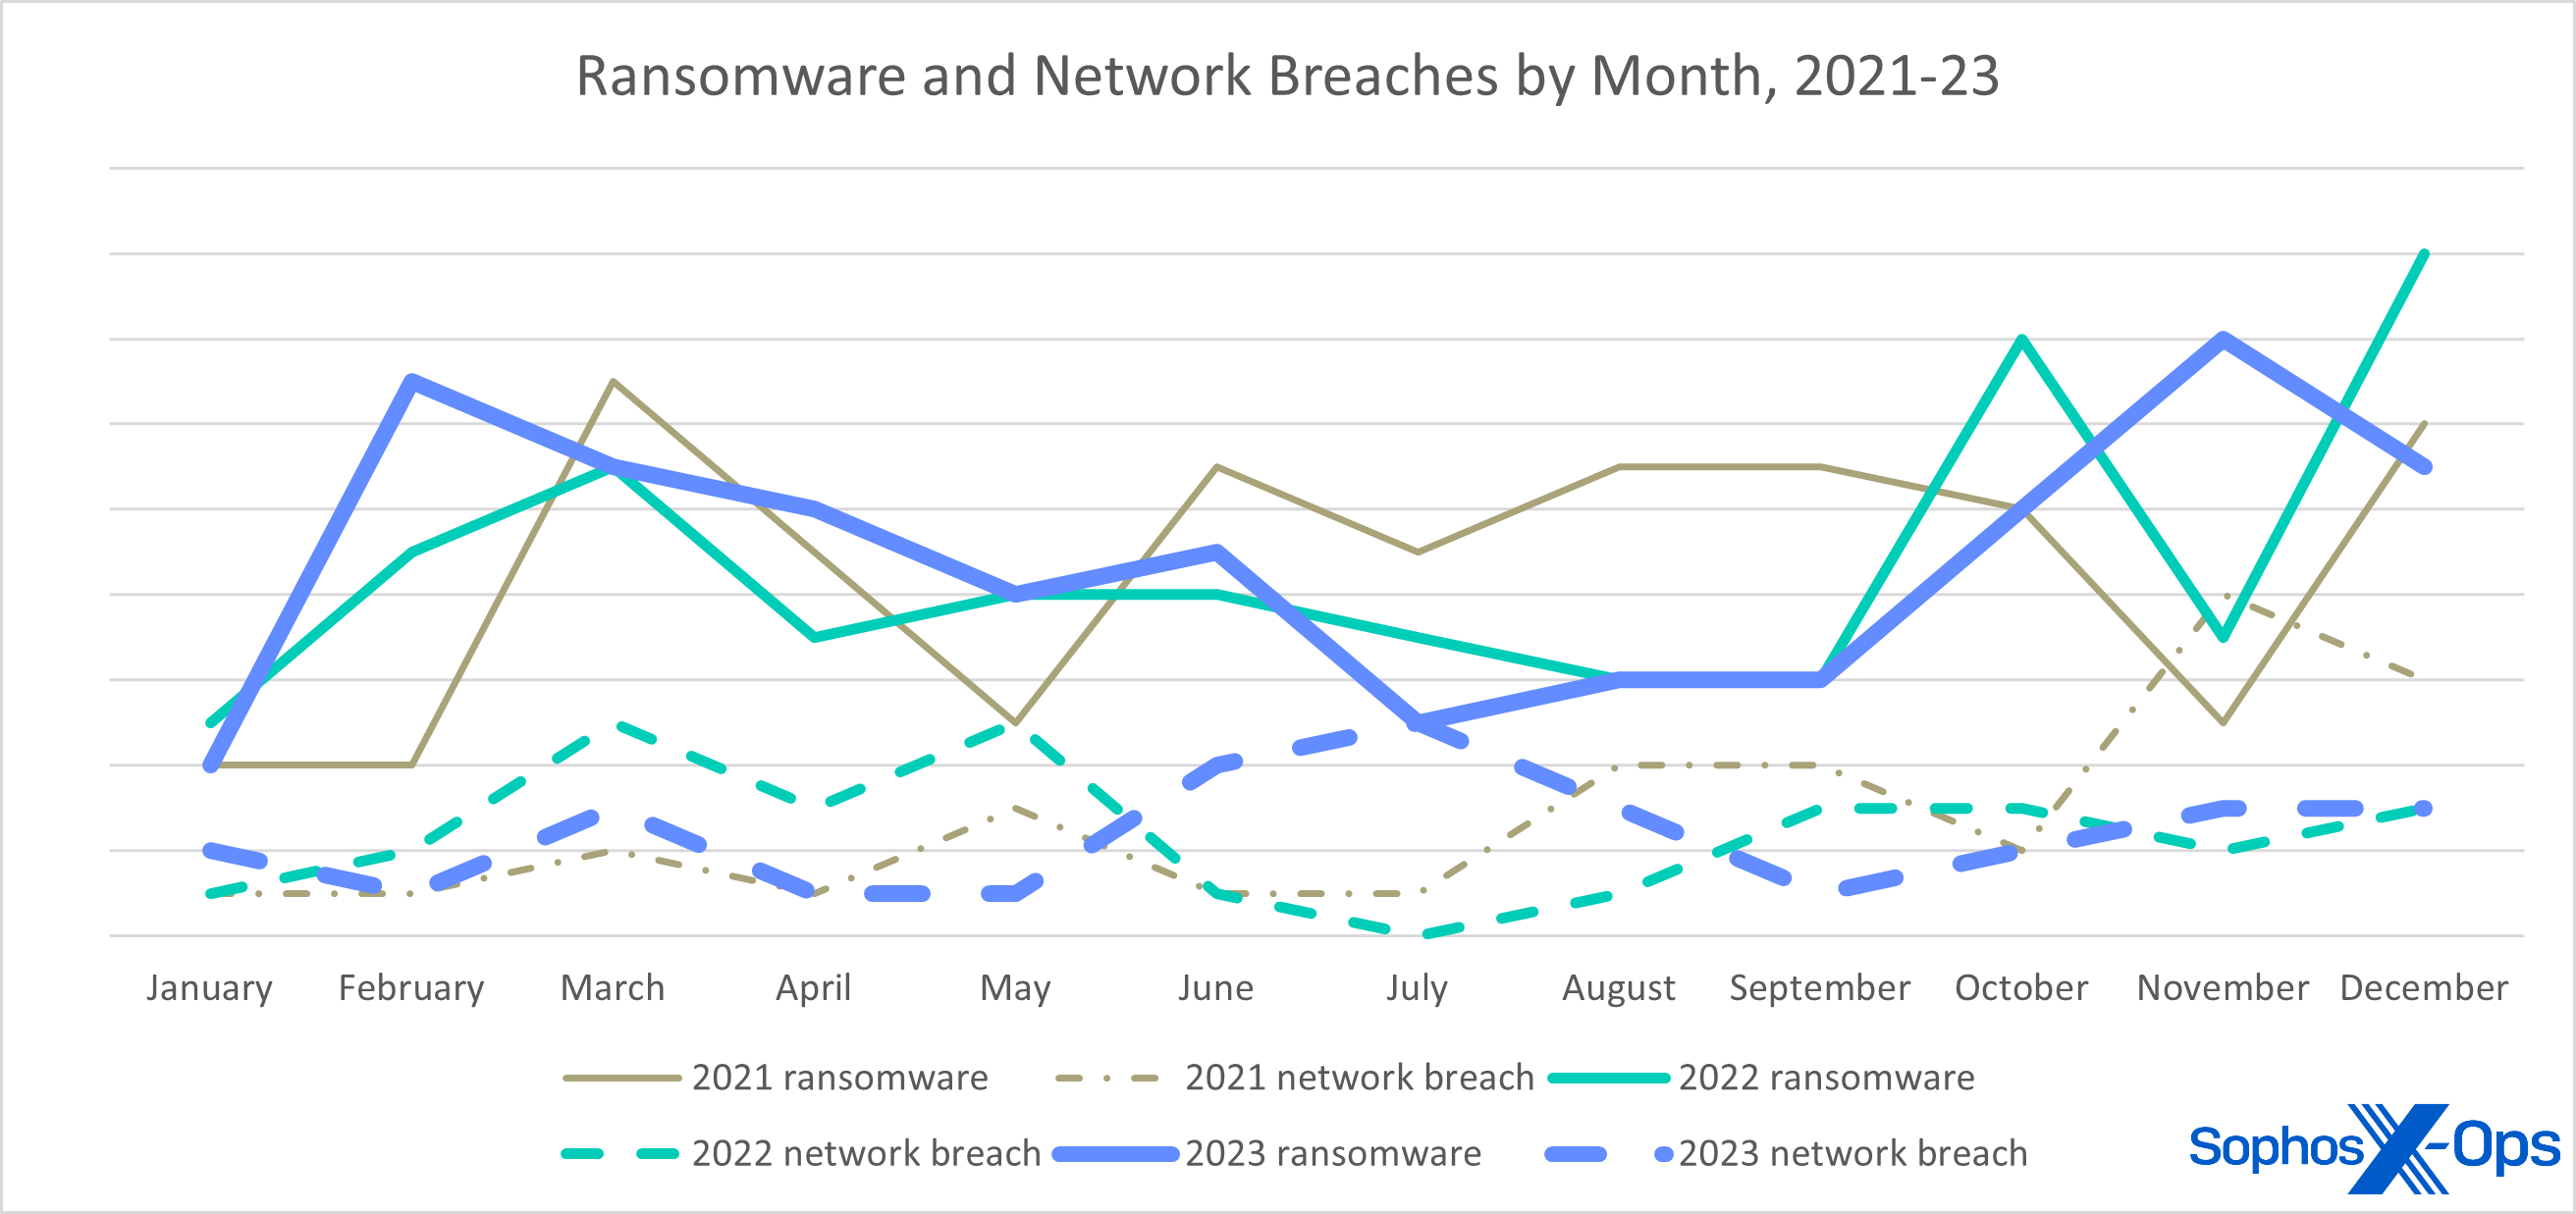
Figure 2: During 2021 and 2022, cycles in the number of ransomware cases and network breaches seemed to have mild congruence – when ransomware was up, breaches were generally up. In mid-2023, however, ransomware dropped just as breaches spiked – not as striking as the full-on reversal of “fortunes” in November 2021, but perhaps more significant
What can be deduced about this from the data itself? Hard to say with even medium confidence, but it’s possible that the set of victims during these two quarters were better prepared to detect ransomware operators and evict them before the real damage was done, or the attackers were distracted during the nicest time of the year in Sochi.
The attack types that have seen the most change in our dataset are data extortion and data exfiltration. We define data extortion as data was stolen and a payment was demanded to suppress and/or delete it. Data exfiltration omits the payment portion; the data was stolen and either exposed to the public or not. Our year-end tally saw data extortion attacks double over the previous year, with data exfiltration attacks halving. Most of the data extortion attacks we investigated were perpetrated in the first half of the year by BianLian, which switched to extortion-only attacks in January 2023.
The remaining attack types for 2023 are business email compromise, web shell, loader, and DDoS. Each accounted for less than 1% of investigated cases.
Impacts
| 2023 Impact | ATT&CK | Count | % cases |
| Data Encrypted for Impact | T1486 | 106 | 68.83% |
| (no impact) | N/A | 29 | 18.83% |
| Inhibit System Recovery | T1490 | 29 | 18.83% |
| Financial Theft | T1657 | 12 | 7.79% |
| Resource Hijacking | T1496 | 6 | 3.90% |
| Account Access Removal | T1531 | 2 | 1.30% |
| Data Destruction | T1485 | 1 | 0.65% |
| Network Denial of Service | T1498 | 1 | 0.65% |
| Grand Total | 186 |
Figure 3: Known impacts of the 2023 cases; since one case may ultimately result in multiple impacts, the total is greater than our case count of 154
The outcome of attacks is the tactic (category) that the MITRE ATT&CK framework calls Impact (TA0040). It should come as no surprise that the Data Encrypted for Impact (T1486) technique is leading the pack: When ransomware is the number-one attack type, this will be the number-one impact. As an adjunct to encryption, many attackers perform other tasks or deploy additional payloads that can be labelled. For example, an often-observed epiphenomenon is the pairing of Inhibit System Recovery (T1490) with Data Encrypted for Impact.
The next most prevalent impact was what we call “no impact.” This is tightly coupled with network breaches. There is no doubt in our minds, and we hope most will agree, that an attacker having privileged access to your network constitutes some sort of impact. And, while MITRE’s techniques cover a lot of ground, there is no discrete technique that adequately describes this phenomenon.
Notably, MITRE released an update to its framework in October 2023. One of the changes was to add the Financial Theft (T1657) technique to the Impact tactic. A stated reason for these changes was for “encompassing more activities that are adjacent to, yet lead to direct network interactions or impacts.” This is a welcome addition as it allows us to properly label the outcomes of data extortion and exfiltration attacks, where previously there was none.
Which segues nicely to the next most prevalent impact: Financial Theft. The increase in this type of data extortion led to a commensurate doubling in this technique, which overtook Resource Hijacking in the 2023 ranking, while Resource Hijacking has dropped to one-third of its 2022 rate. This technique is sometimes the result of attackers using compromised systems for spam campaigns, as is the case in many SquirrelWaffle infections, but most often the technique denotes a coin miner being present on the network. (It is unclear why coin miners are in decline, other than the fact that they aren’t terribly lucrative.)
With the exception of one Network Denial of Service attack against an entity in the Education sector, the remaining techniques in our dataset were secondary impacts paired with ransomware attacks.
Attribution
| 2023 Attribution | Count | % |
| LockBit | 24 | 22.22% |
| Akira | 12 | 11.11% |
| ALPHV/BlackCat | 10 | 9.26% |
| Play | 7 | 6.48% |
| Royal ** | 6 | 5.56% |
| Black Basta | 5 | 4.63% |
| CryTOX | 4 | 3.70% |
| BlackByte | 3 | 2.78% |
| Team Snatch | 3 | 2.78% |
| Mario | 3 | 2.78% |
| Rorschach | 2 | 1.85% |
| Faust | 2 | 1.85% |
| (unknown) | 2 | 1.85% |
| BitLocker* | 2 | 1.85% |
| Vice Society | 2 | 1.85% |
| Phobos | 2 | 1.85% |
| BlackSuit ** | 2 | 1.85% |
| Rhysida | 2 | 1.85% |
| Prometheus | 1 | 0.93% |
| Hunters Intl | 1 | 0.93% |
| INC | 1 | 0.93% |
| Cyclops | 1 | 0.93% |
| Cuba | 1 | 0.93% |
| 8Base | 1 | 0.93% |
| Money Message | 1 | 0.93% |
| HIVE | 1 | 0.93% |
| RA Group | 1 | 0.93% |
| Mimus | 1 | 0.93% |
| FuxSocy | 1 | 0.93% |
| d0nut | 1 | 0.93% |
| NoEscape | 1 | 0.93% |
| Qilin | 1 | 0.93% |
| RansomEXX | 1 | 0.93% |
| Grand Total | 108 | 100.00% |
Figure 4: Family distribution of ransomware cases evaluated in 2023. For the entry marked with an asterisk, the attacker installed Windows BitLocker services to both encrypt files and remove volume shadow copies. For the entries marked with two asterisks, there’s a possibility these are the same thing, as discussed below
Few threat landscape analyses are complete without an attribution discussion. While we won’t pontificate at length over who was behind many of these attacks, we can present the facts as we saw them. Naturally, the most reliable attributions come from ransomware attacks. This is because the attackers tell you which brand of ransomware was deployed on your network through file extensions (often), ransom notes (always), and data leak portals (sometimes). Like so many telemarketers, most ransomware brands exist as ransomware-as-a-service offerings, which allows criminals to represent more than one outlet.
LockBit maintains the top spot for most prolific ransomware brand of the year for the second year running, finally displacing Conti in our all-time ranking. More than one-fifth of ransomware attacks we investigated in 2023 deployed LockBit.
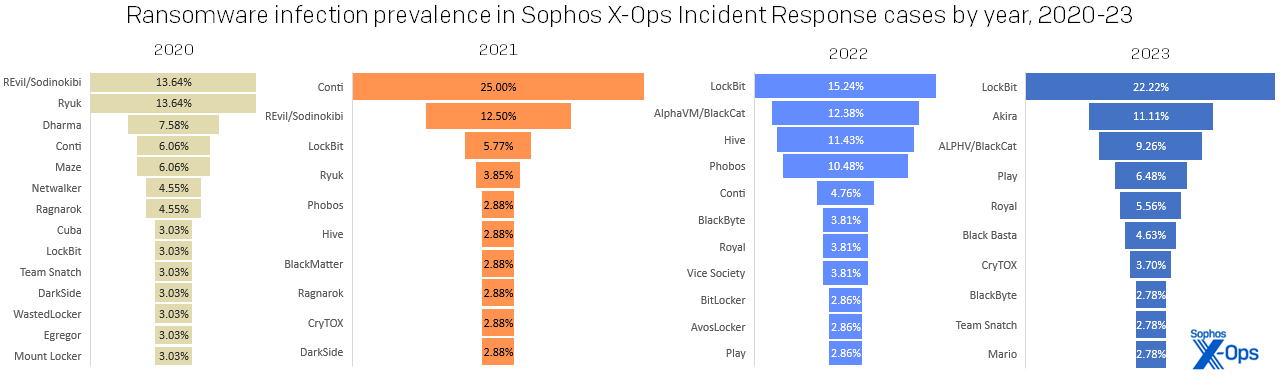
Figure 5: LockBit dominated the 2023 standings more strongly than any single ransomware family has since the heyday of Conti, in 2021; then as now, the second-place family represented a mere half of the leader’s total
One notable entrant in the ransomware landscape was Akira. First launched in March 2023, this up-and-coming brand placed second in our ranking, displacing other notable brands like ALPHV/BlackCat, Royal (likely rebranded in 2023 as BlackSuit), and Black Basta. (Were we to combine Royal and BlackSuit on our chart, it would be in fourth place in the ranking.) But this level of breakaway success doesn’t necessarily mean infallibility. One of the cases we investigated as a network breach was found to be a failed Akira attack, as were cases involving ALPHV, Black Basta, Everest, and Vice Society. Had these attacks succeeded, they would have increased the ransomware share to 73%, with a proportional drop in the network breach percentage.
The top five ransomware brands were responsible for over half (55%) of all ransomware attacks, which is not surprising considering the pedigrees of some of these brands. Akira and Royal have both been linked to the Ryuk branch of ransomware families, which as many will know begat the Conti ransomware group and its many descendants. If we expand to the top 10, we find two more of Conti’s alleged progeny, Black Basta (#6) and BlackByte (#8). Of the data extortion groups, we also find that Karakurt has potential links to this prodigious branch. Even LockBit is related in a sense, because that group has been observed using some of Conti’s code after the leaks in 2022.
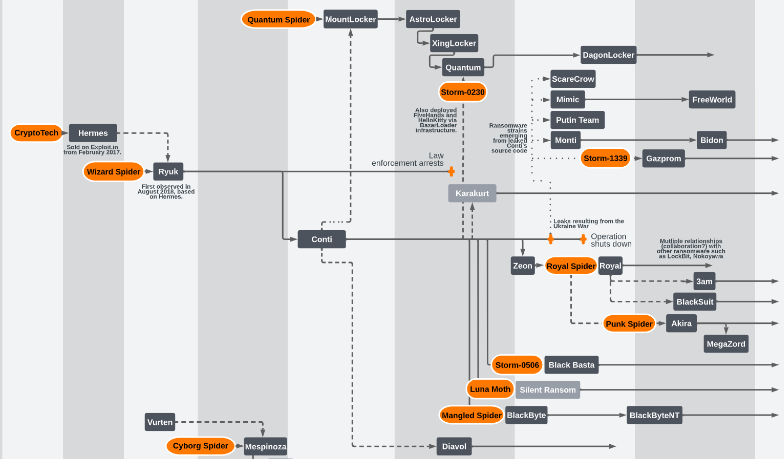
Figure 6: Fruits of a poisoned tree: Most modern ransomware families are related to a few “founding” entities, starting with 2016’s CryptoTech; the uncertainty re the likely renaming of Royal to BlackSuit is reflected at lower right. Source: https://github.com/cert-orangecyberdefense/ransomware_map/blob/main/OCD_WorldWatch_Ransomware-ecosystem-map.pdf , of which this diagram is just a small portion
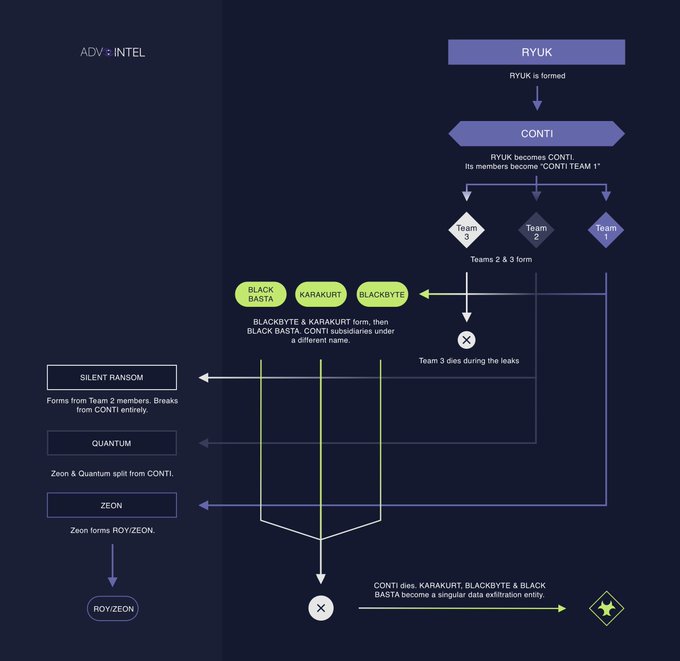
Figure 7: A closer look from 2022 at the (somewhat inbred) Conti family. Source: https://twitter.com/VK_Intel/status/1557003350541242369/photo/1
It’s tempting to think that there’s something special about these groups, but there isn’t. Modern ransomware turned 10 years old in mid-September 2023. The reality is that many of the individuals behind these groups have been active for a while and have had plenty of time and opportunity to hone their skills. For various reasons, ransomware groups come and go, but we’ve also observed a few, namely Cuba, LockBit, Phobos, and Snatch, that have been part of our investigations since the first Active Adversary report.
| 2023 Attribution (data extortion cases) | Count | % of cases |
| BianLian | 8 | 72.73% |
| Cl0p | 1 | 9.09% |
| Hunters Intl | 1 | 9.09% |
| Karakurt | 1 | 9.09% |
| Grand Total | 11 | 100.00% |
Figure 8: BianLian dominated the data-extortion cases we saw; though Cl0p made plenty of headlines, its actual impact on our IR customers was vanishingly small
Of the data extortion group, BianLian led the way, followed by Cl0p, Hunters International, and Karakurt. The Hunters International attack was a failed ransomware attack, but having stolen data, they resorted to data extortion by demanding payment to suppress publication of the stolen data.
Don’t call it a comeback — I been here for years
Knowing who attacked you might offer some emotional rescue, but it really doesn’t matter — except in one scenario. If you intend to pay, it’s absolutely necessary to confer with legal counsel beforehand, in case the ransomware group in question has been designated as a sanctioned entity by your government.
In any case, many ransomware attacks, regardless of the branding on the ransom note, are perpetrated by the same individuals or groups of individuals, and they largely use the same tooling and infrastructure. What matters most in the incident-response context is how the attackers breached the organization and why they succeeded. This allows for full remediation and recovery.
Down in the Hole: Initial Access and Root Causes
| 2023 Initial Access | ATT&CK | 2023 count | % of 2023 cases | % of cases all-time |
| External Remote Services | T1133 | 100 | 64.94% | 45.95% |
| Valid Accounts | T1078 | 78 | 50.65% | 25.24% |
| Exploit Public-Facing Application | T1190 | 26 | 16.88% | 25.05% |
| (unknown) | N/A | 15 | 9.74% | 7.34% |
| Phishing | T1566 | 6 | 3.90% | 5.46% |
| Supply Chain Compromise | T1195 | 4 | 2.60% | 0.75% |
| Trusted Relationship | T1199 | 3 | 1.95% | 1.88% |
| Drive-by Compromise | T1189 | 2 | 1.30% | 0.75% |
| Grand Total | 234 |
Figure 9: Initial access methods, when discernible in the course of investigation, exhibited a bit of diversity in 2023. As one would expect, some cases reveal multiple plausible initial-access scenarios. Most significantly, of the 78 Valid Accounts cases we saw, in only one was Valid Accounts the primary method; in the other 77, it was a contributing factor in cases involving Remote Services
| 2023 Root Cause | 2023 count | % of 2023 cases | % of cases all-time |
| Compromised credentials | 86 | 55.84% | 33.33% |
| Exploit vulnerability | 25 | 16.23% | 29.76% |
| (unknown) | 20 | 13.64% | 18.27% |
| Brute force attack | 6 | 3.90% | 3.01% |
| Phishing | 5 | 3.25% | 5.65% |
| Supply chain compromise | 4 | 2.60% | 1.13% |
| Malicious documents | 4 | 2.60% | 3.20% |
| Adware | 2 | 1.30% | 0.56% |
| Auth token theft | 1 | 0.65% | 0.19% |
| Grand Total | 154 | 100.00% |
Figure 10: As for root causes, compromised credentials top the full-year charts for the first time ever in 2023
The MITRE tactic and the associated techniques that describe how an attacker managed to infiltrate the target are grouped under Initial Access (TA0001), whereas Root Causes, which do not have formal ATT&CK designations, describe why that technique worked. For example, if the attackers infiltrated the network through an external remote service, such as a VPN, that would be how they got in. But the root cause — why that technique worked — was likely due to compromised (stolen) credentials (in MITRE ATT&CK terminology, Valid Accounts). We would argue that in this example, both External Remote Services and Valid Accounts provided initial access, with compromised credentials acting as a root cause. While the two often line up, we still like to separate them so we can better understand how the attack succeeded, which informs remediation and defense.
As has been the case for every Active Adversary report so far, External Remote Services (T1133) was the leading initial access method. In 65% of cases, some sort of remote access technology facilitated the intrusion; be that a VPN device or an exposed Remote Desktop Protocol (RDP) service, the attackers had a target of opportunity. All that remained was figuring out how to take advantage of this opportunity.
One way to exercise that opportunity is by using Valid Accounts (T1078). Over three-quarters (77%) of attacks saw compromised credentials as an initial access method and over half (56%) as a root cause. In most cases, we don’t know how the accounts were compromised, but we do know that the attackers walked through the front door using a valid username and password.
It turns out that most cases in 2023 saw that pairing of initial access and compromised credentials. We noted in our previous report that compromised credentials had rocketed to the top of the Root Cause charts in the first half of 2023. Now that we have a complete dataset for 2023, we see that the trend holds, nearly doubling last year’s total.
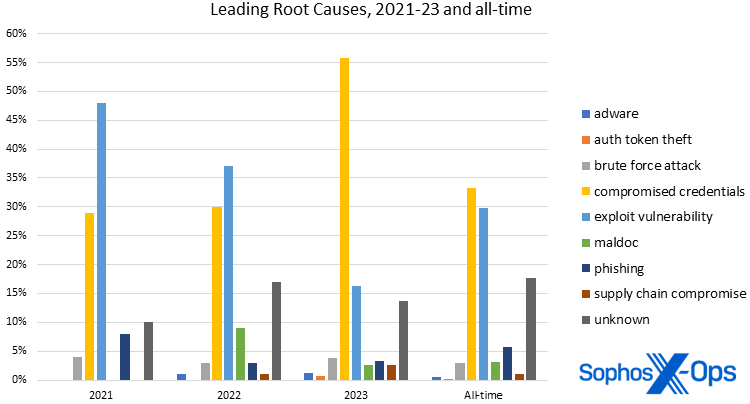
Figure 11: The astonishing rise of compromised credentials as a root cause of attacks vaulted the (largely avoidable) problem to the top of the all-time charts as well as 2023’s
What makes this worse is the woeful state of credential hardening. In 43% of investigations, multi-factor authentication (MFA) was not configured. (As a reminder, MFA is technology that’s nearly three decades old at this point; one of the founding patents literally gives an implementation example involving two-way pagers.)
The remaining root causes for attacks involving remote services were brute force attacks (6%), unknown (3%), phishing (3%), and exploits (2%).
Considering compromised credentials’ ascendency, plain old vulnerability exploitation has therefore slipped to second place. As we have written previously, this isn’t irrefutable evidence that attackers have gone off using vulnerabilities. Maybe there weren’t as many easily exploitable vulnerabilities as there were in previous years. Or maybe initial access brokers had a lot of inventory on their hands that they wanted to get rid of cheaply. Whatever the case, attackers will choose the path of least resistance, and for 2023, that meant using compromised credentials.
Beyond the top “three” (since it’s debatable how useful “unknown” as a category is to investigators, even when the contributors to the category are known), the remaining identified root causes – brute force attack, phishing, supply chain compromise, maldocs, adware, and authentication token theft – accounted for a combined 14% of findings. The Unknown category is the third most common “reason” for both initial access and root cause, and the biggest contributor in both cases was missing telemetry. Whether the logs were cleared by the attackers or worse, not configured, our investigators were unable to determine key aspects of the attack. Frankly, in 2023 compromised credentials and exploited vulnerabilities were the ball game.
Hey baby – it’s the stats, man!
With the adversary landscape in a relatively calm period at this writing, let’s take a moment to think about, as the Active Adversary report team often says, how we know what we know. To be sure we’re getting the maximum good out of all the data we offer in these reports, let’s talk about statistics and what they can show – or hide. We’ll first examine the remarkable drop in dwell times that we covered throughout 2023 to see what else we might learn from one more look at those numbers. Next, we’ll look at time-to-Active Directory, a statistic we started monitoring only last year, to see how analysis helps us see that picture as it develops. After that, we’ll examine a topic where lack of crucial data leaves researchers in an awkward position, and close this section with a look at a statistic that fell unexpectedly out of the dataset in the middle of last year and still has us asking questions.
Stats #1: Attack timelines: Time is on your side (until it’s not)
When we published our first Active Adversary report in 2021 (based on 2020 data), dwell time was one of those measures that sparked a lot of interest. Back then we were used to thinking about dwell time in weeks and months, but we were able to show that the median dwell time, specifically for incident response cases, was measurable in days. 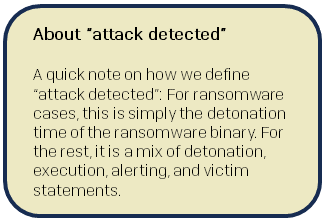
In the next report (based on 2021 data), we saw dwell time rise and attributed this to the emergence of Initial Access Brokers (IABs), which provided a buffer between the earliest compromise and the eventual attack.
Then the decline started — by a bit in 2022, then by a lot in 2023. The first quarter of 2023 (which included data through the end of 2022) was business as usual, with dwell time equaling that of the previous year. By the time we released our final report in 2023 (which included Q1-Q3 data), dwell time had halved. By the time we wrapped up the year things had stabilized. As is often the case, understanding the details is important.
| 2023 Incident Dwell Times (by quarter) | |||||
| 2023 | Minimum | Maximum | Mean | StdDev | Median |
| Q1 | 0 | 112 | 18.69 | 24.06 | 10.00 |
| Q2 | 0 | 73 | 12.37 | 15.66 | 7.00 |
| Q3 | 0 | 114 | 16.86 | 31.18 | 5.00 |
| Q4 | 0 | 289 | 23.76 | 49.33 | 8.00 |
| Full year | 0 | 289 | 18.18 | 33.08 | 6.00 |
Figure 12: The dwell-time numbers wobbled a bit throughout 2023, but still landed firmly below the previous median dwell time of 10 days
One reason we choose to look at dwell time (and many other measures) using its median value is to reduce the impact of outliers. For example, in 2022 we had a case with a legitimate dwell time of 955 days. If we compare this dataset with one that omits that case, the mean reduces by a little over 6 days, but the median is unaffected.
What a Difference a Case Makes
| 2022’s extraordinary outlier and how it affected dwell statistics | |||||
| Minimum | Maximum | Mean | StdDev | Median | |
| With outlier | 0 | 955 | 36.99 | 95.32 | 10.00 |
| Without outlier | 0 | 345 | 30.78 | 58.11 | 10.00 |
Figure 13: A single extraordinary outlier in the dataset can cause outsized distortion in the numbers, which is why we like to look at median values
Another value that we track, but don’t usually draw much attention to, is the standard deviation of a dataset. Put simply, the standard deviation measures the spread or variability of data from its mean. Using the dataset in Figure 13 as an example, we also experience a dramatic lowering of the standard deviation in dwell time, from 95.32 days to 58.11 days, when we omit the outlier. In other words, the set of values that make up the data are closer to the mean.
The problem with some outliers is that they can obscure patterns in the data. With this in mind, we examined the dwell time data for the past three years, while controlling for the outlier in 2022 as shown above:
| Attacker Dwell Time Statistics (with 2022 outlier case removed), 2021-23 | |||||
| Dwell time | Minimum | Maximum | Mean | StdDev | Median |
| 2021 (n=144) | 0 | 411 | 41.69 | 59.65 | 13.00 |
| 2022 (n=148) | 0 | 345 | 30.78 | 58.11 | 10.00 |
| 2023 (n=147) | 0 | 289 | 18.16 | 33.08 | 6.00 |
Figure 14: Having eliminated the effect of the outlier from the 2022 data, the year-to-year trend of decreasing dwell times becomes clear
We posited in a previous report that shrinking dwell times were likely due to several factors, including increased detection capabilities, and that attackers have likely sped up in response.
In addition to shrinking median dwell time, we also observed, as we see in Figure 14, the remaining values declining despite similarly sized populations. Things get even more interesting when we separate ransomware from all other attack types:
| Dwell Time in Ransomware Attacks, 2021-23 | |||||
| Minimum | Maximum | Mean | StdDev | Median | |
| 2021 | 0 | 190 | 29.88 | 42.29 | 11.00 |
| 2022 | 0 | 292 | 23.80 | 45.42 | 9.00 |
| 2023 | 0 | 146 | 15.92 | 25.53 | 5.00 |
| Dwell Time in Non-Ransomware Attacks, 2021-23 | |||||
| Minimum | Maximum | Mean | StdDev | Median | |
| 2021 | 1 | 411 | 72.38 | 83.58 | 52.50 |
| 2022 | 0 | 345 | 45.79 | 77.25 | 10.00 |
| 2023 | 0 | 289 | 23.22 | 45.79 | 10.00 |
Figure 15: Again with the 2022 outlier dismissed from the data, we see that the decrease in dwell times applies to both ransomware infections and (to a lesser extent) all other attack types
It makes intuitive sense that ransomware attackers would spend less time than other types of attackers inside networks. Today it seems some of these attackers rely less on individual payouts and more on volume. (This is apparently working out for them; according to statistics published earlier this year by Chainalysis, payouts for 2023 likely surpassed $1 billion USD.) The attacks themselves can be noisy, especially when payloads are introduced into the network. In contrast, web shell implants and coin miners are meant to be stealthy and persistent.
Measuring dwell time and commenting on its meaning has been a fixture of this report since its inception. We’ve included it here for completeness, but like many aspects of the threat landscape and attacker behavior, we think dwell time has reached stasis. It is unlikely that these dwell time values will change dramatically in the short term. Like ransomware prevalence, there might be some variability from year to year, but the overall trend will remain stable, and it will of course never reach zero.
Dwell time is a lagging indicator. It can only be calculated after the intruders have been discovered. One way to shrink dwell time is to detect intrusions sooner, and there are other time-based indicators that can help defenders spot suspicious activity in the network – if, of course, you’re watching for that sort of thing.
Stats #2: To AD or not to AD: Active Directory takes the stage
In 2023, to better understand attacker timelines, we started capturing the time-to-Active-Directory (AD) metric. What we found is that the median time-to-AD for all attacks in 2023 was 0.64 days. The earliest time-to-AD was –28.90 days, while the longest was 281.45 days. This contrasts with the time difference between getting access to an AD server and when the attack is detected: Here we saw a median of 2.02 days.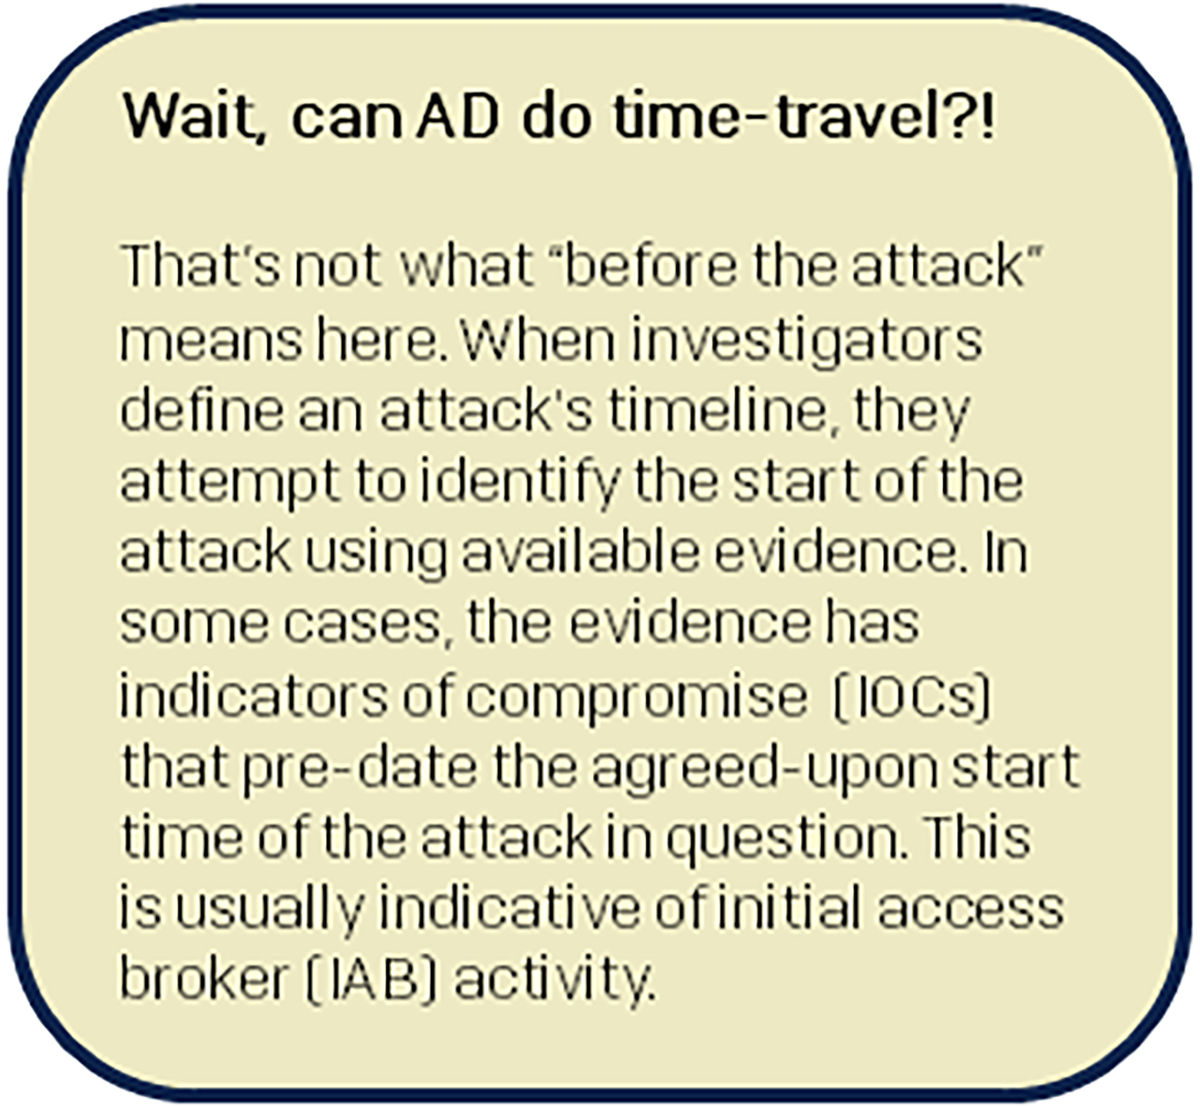
Where available, we also recorded the operating system version of affected AD servers. This can be significant since Microsoft steadily improves the baseline security of AD over subsequent releases. We found that 90% of AD servers were running Windows Server 2019 – which exited mainstream support in January 2024 – or earlier versions. (The case dataset included three deployments of Windows Server 2008.) We further noted that 79% of AD servers were protected only with Windows Defender, and at least two servers had no protection whatsoever.
Sometimes, as all researchers will tell you, what looks interesting in a smaller dataset gets overturned by examining a larger one. Since no good deed goes unpunished, we went back to collect the time-to-AD data from the 152 cases investigated in 2022 so we could understand the bigger picture and compare the values. As it was for dwell time, the 2022 median time-to-AD was 1.34 days — more than double the median for 2023. The earliest time-to-AD was -208.29 days (yes, a negative number; in that case, the customer experienced an AD compromise that long predated other artifacts related to their network breach) and the longest was 140.64 days. In 2022, 98% of AD installations were Windows Server 2019 or earlier, and 69% were protected with Windows Defender.
Armed with the knowledge that some attackers are making a mad dash for Active Directory servers, we must be prepared to detect them post-haste. Part of that preparation includes having the right solutions in place to detect suspicious activity, the people available to investigate suspicious signals, and the necessary telemetry to determine what happened.
Moving past the necessary grind of statistics, we turn our attention now to…
Stats #3: Exfiltration (you don’t know what it’s got ‘til it’s gone)
Data theft is another opportunity for detecting an intruder. When faced with data exfiltration or data extortion, time has already run out. However, when facing a ransomware attack, there is still an opportunity to detect the intruders and evict them from the network before they proceed to the final act.
All-cause data exfiltration occurred at roughly the same rate in 2023 as it did in 2022. We could confirm exfiltration in 40% of cases; a further 14% had indications of possible exfiltration or of data staging (an activity one would expect to see in the course of an exfiltration attempt). The previous year saw 43% confirmed exfiltrations with an additional 9% determined as possible data theft.
Another area where missing logs hampers investigations is in determining whether exfiltration has occurred. In 42% of cases, incident responders were unable to determine from the available evidence whether any exfiltration had occurred. This was largely due to there being no evidence available for responders to confirm or deny whether exfiltration happened. Breaking it down further, of the 55 cases lacking sufficient evidence, 29 cases (53%) were missing logs and an additional 6 cases (11%) had logs erased by the attackers.
For ransomware attacks we could confirm data exfiltration in 44% of cases, with an additional 18% showing possible data exfiltration or data staging. Unfortunately, we were unable to determine if data was stolen in 30% of cases. Of those cases, 69% were hampered by missing logs, with 56% due to missing logs and 13% due to cleared logs.
Alarmingly, 72% of network breach investigations found no evidence of data exfiltration. More than half of the missing evidence was due to missing (43%) or deleted (14%) logs.
There is an inverse relationship between time-to-AD and data theft. Where attackers rush to get access to AD, the data exfiltration component of a ransomware attack appears to come at the end of the campaign. For example, in the 2023 data, the median time between the start of the attack and the deployment of a ransomware payload in a confirmed exfiltration was 3.76 days. In contrast, the time between exfiltration and deployment was 0.6 days.
As with time-to-AD, this metric is only useful if an organization has the necessary elements in place to detect and respond to a data exfiltration event. If exfiltration is the ultimate goal of the attackers, the organization can quickly determine their exposure and begin the process of notifying regulators and other stakeholders. As governments around the world increase their rules and regulations concerning data breaches, victim organizations will need to respond in kind. If the exfiltration event is a precursor to a ransomware attack, detecting a data exfiltration event could mean the difference between a bad day at the office and a very bad day in the news.
Stats #4: Ransomware’s night moves
One of the most surprising results from our data analysis for the mid-year report in 2023 was a strong pattern in the local time of day when ransomware was deployed. For that report, the dataset included all cases from the first half of 2023. Analysis showed that 91% of ransomware payloads were deployed outside of traditional business hours. As we did for time-to-AD, we eagerly awaited the full-year data to see if the results would be upheld by a bigger dataset, since (as noted above) larger datasets often expose biases in data and effects can get watered down. While we waited, we re-examined the data and corrected for countries where business days are not traditionally Monday to Friday. (The original analysis assumed the “workweek” to be five standard working days of 8am to 6pm, Monday through Friday; the “weekend” was held to be the period between 6pm on Friday and 12am on Monday.)
While there was a small correction applied by doubling the dataset, we found that 90% of ransomware deployments were deployed outside of business hours in 2023. A total of 11 attacks were launched during local business hours in the workweek.
Since we were already re-analyzing cases for time-to-AD, we also attempted to capture the ransomware deployment time for 2022. What we found was that 94% of ransomware deployments occurred outside of business hours. Only six cases fell within office time.
While we won’t consider these results definitive – we don’t have visibility into every ransomware attack – we can pronounce with high confidence that ransomware deployments are most prevalent outside of traditional business hours. When looking at both 2022 and 2023, 92% of ransomware attacks support this finding.
One thing we can conclude by analyzing attacker timelines is that time can be on our side during an attack. Despite shrinking dwell times, defenders still have a median 6 days to detect an intruder. However, these times change dramatically when a motivated actor strikes. In the case of ransomware in 2023, the median time shrinks to 5 days, versus 10 days for all other attack types.
In addition, there are signs along the way that can alert defenders to a potential danger lurking in the network. Immediately detecting an intruder on an Active Directory server can mean stopping an attack in less than 24 hours. Spotting a data exfiltration event can prevent an even more devastating outcome.
We know that through years of practice many ransomware criminals have honed their skills. But this is not a one-way battle. Defenders can also sharpen their skills by practicing response playbooks – and, as this section has shown, by the true understanding of what the statistics are saying.
Same as it ever was: Artifacts, LOLBins, and other findings
Turning our attention from the statistics to the usual examination of tools and tactics, techniques, and procedures (TTPs), analyzing this year’s crop evokes strong feelings of déjà vu. We observed the same items in each top five, albeit in slightly different orders, year-on-year. It’s not until we look past the top ten that we start seeing variability. Nowhere is this stasis more apparent than in the tools used and abused by attackers in the past three years. In both the detected tools and Microsoft binaries, the top ten are nearly identical. It’s almost as if the attackers aren’t being challenged and can simply re-use the same tools and TTPs ad infinitum.
Artifacts
| Most Commonly Encountered Artifacts of 2023 | |||
| 2023 Artifacts | 2023 count | % of cases 2023 | % of cases all-time |
| SoftPerfect Network Scanner | 51 | 33.12% | 22.79% |
| Cobalt Strike | 41 | 26.62% | 38.61% |
| AnyDesk | 40 | 25.97% | 23.16% |
| Advanced IP Scanner | 39 | 25.32% | 20.72% |
| mimikatz | 37 | 24.03% | 26.93% |
| Impacket | 34 | 22.08% | 5.27% |
| WinSCP | 28 | 18.18% | 10.17% |
| Rclone | 24 | 15.58% | 13.37% |
| PuTTy | 23 | 14.94% | 11.30% |
| 7zip | 20 | 12.99% | 9.42% |
| WinRAR | 20 | 12.99% | 11.86% |
Figure 16: SoftPerfect Network Scanner leads the list of artifacts spotted in 2023 IR cases, displacing Cobalt Strike from the perch it has held since the start of the Active Adversary Report series; however, Cobalt Strike still leads the all-time occurrence list
Despite the top tools being similar year-on-year, there is one trend that might signal a change in attacker behavior. Cobalt Strike, the longstanding leader, has seen its share decline steadily in the past three years. While it still maintains the top spot in the all-time rankings by absolute count, the percentage of attacks using a Cobalt Strike payload has declined significantly; in the period from 2021 to 2023, the share of Cobalt Strike has gone from 48% to 27%. A potential reason for this is that Cobalt Strike has been so heavily abused that we have become very adept at detecting and blocking it.
The overall leader this year was SoftPerfect’s Network Scanner, which is routinely abused by attackers to map out networks and discover potential targets. We’ve seen abuse of this software for many years and its utility hasn’t gone unnoticed by the attackers. Another frequently abused, albeit legitimate, application is AnyDesk, the popular tool for administrators to manage their endpoints.
One interesting element of the top 10 is that 50% of the tools facilitate data exfiltration. Both 7zip and WinRAR (again, tools with legitimate uses, but abused by attackers) are routinely used to create archives that enable and potentially obfuscate data theft, while the others enable the collection and transfer of said archives. Unfortunately, many organizations still don’t have a firm enough grasp on what normal looks like, so they miss large transfers of data leaving their network. (As an example, the MEGA cloud storage service is all too often abused by data exfiltrators; if you have traffic either coming from or going to MEGA and you have no pre-existing business relationship with the company, that’s worth investigating.)
An interesting side note is the incidence of the tool Impacket in our dataset. As described by the maintainer of the project: “Impacket is a collection of Python classes for working with network protocols.” As this is a collection of tools, we record their individual use (e.g. Impacket/atexec, Impacket/secretsdump, Impacket/smbproxy, etc.) to better understand how each is used in an attack. However, if we roll all the individual tools into one “Impacket” data point, a significant result emerges. All uses of Impacket in 2023, counted together, would rank sixth in the artifacts list.
With few exceptions, most of the tools in this category are prime candidates for monitoring and blocking.
MS-LOLBins
| Most Commonly Encountered Microsoft LOLBins of 2023 | |||
| 2023 MS-LOLBins | Count | % of cases 2023 | % of cases all-time |
| RDP | 139 | 90.26% | 83.80% |
| PowerShell | 120 | 77.92% | 71.94% |
| cmd.exe | 83 | 53.90% | 29.94% |
| net.exe | 60 | 38.96% | 26.93% |
| PsExec | 60 | 38.96% | 43.88% |
| Task Scheduler | 55 | 35.71% | 25.99% |
| rundll32.exe | 43 | 27.92% | 22.79% |
| ping.exe | 41 | 26.62% | 15.63% |
| nltest.exe | 31 | 20.13% | 10.73% |
| reg.exe | 31 | 20.13% | 12.62% |
Figure 17: RDP continues to rule the MS-LOLBin roost, with PowerShell the constant runner-up
Remote Desktop Protocol (RDP) is once again the most abused of all the Microsoft LOLBins (living-off-the-land binaries). We won’t spend much time discussing RDP in this report – instead, please see our special supplemental coverage, which goes into both statistics and recommendations for dealing with the protocol — but we do think it’s on track for a lifetime achievement award. RDP abuse has reached new heights, with 90% of attacks using it for internal lateral movement and 20% for external remote access. As for the 18% of organizations who still have RDP exposed to the internet, you should ask yourself, “My God, what have I done?” (To find out how that has worked out for one Sophos customer, keep reading; this report’s Case Study section is just ahead.) At publication time, there were approximately 4 million exposed RDP systems on the internet.
![]()
Figure 18: In 2023, nine out of ten attacks handled by our IR team included evidence of RDP abuse
Setting RDP aside, PowerShell continues to power many attacks due to its ubiquity, privilege, flexibility, and usefulness. It is difficult to argue for its removal from networks; therefore, the only option is to strictly monitor and control it. Strategies for using PowerShell safely and securely include (but are not limited to): logging all PowerShell activity, applying the principle of least privilege to which accounts can run scripts, running the latest version, and enabling constrained language mode.
The rest of the binaries in this list are used for various purposes, including execution, persistence, defense evasion, discovery, and lateral movement. Having visibility into all your devices and the capacity to act when necessary is a requirement for today’s defenders.
Other
| Most Commonly Encountered Other Findings of 2023 | |||
| 2023 other | Count | % of cases 2023 | % of cases all-time |
| valid accounts | 122 | 79.22% | 44.26% |
| install service | 92 | 59.74% | 42.56% |
| logs missing | 83 | 53.90% | 17.89% |
| browse network | 79 | 51.30% | 28.06% |
| malicious scripts | 73 | 47.40% | 50.09% |
| disable protection | 73 | 47.40% | 30.70% |
| MFA unavailable | 66 | 42.86% | 19.96% |
| create accounts | 52 | 33.77% | 20.72% |
| logs cleared | 49 | 31.82% | 22.03% |
| modify local groups | 35 | 22.73% | 9.98% |
| lsass dump | 35 | 22.73% | 17.33% |
Figure 19: A traditionally more volatile category than either Artifacts or LOLBins, the catchall Other category has been led for two years now by Valid Accounts; it was preceded in 2020 and 2021 by Malicious Scripts
The techniques and other indicators that we observed this past year are also very much standard operating procedure for many attacks. This section of our findings data is usually where we see the most variability. For example, we use this category to track specific exploits that are being used in the wild, and those often change from year to year, but those mostly make up the long (>200) tail of this dataset. Front and center are techniques and observations that contribute to the fog of war that surrounds many investigations.
A few words about missing and cleared logs, a topic we’ll tackle more fully in a later Active Adversary publication: Attackers have become adept at disabling protection and clearing their tracks. This concerted effort to blind defenders is usually in the service of remaining undetected. However, there are unintended consequences to disabling protection that can be to a defender’s advantage. A telemetry signal going dark should be a beacon that something is happening in the environment which requires immediate attention.
Never mind attackers trying to blind us; in many cases we’re blinding ourselves.
In 2023 we started capturing the incidence of missing telemetry, since the data showed that this was the case in 54% of attacks we investigated. What was most surprising was how prevalent this new metric turned out to be: In its first year of AAR scrutiny, it cracked the top 10 in our all-time ranking. While there were several reasons why the logs were unavailable, in most cases it was because organizations hadn’t taken the necessary steps to ensure they would be there when it mattered most.
And, as if the overwhelming amount of credential compromise wasn’t enough, 43% of organizations had neglected to enable MFA on their external services. There is no other way to put this: When a solution exists that can stop an attacker in their tracks, and it is not implemented, it is willful negligence. In the final section of our report, we’ll look at how that worked out for a specific MDR customer.
Case study: You got another thing comin’ (and another and another and)
Over and over in the Active Adversary report series, we’ve repeated three fundamental security principles – basic hygiene for defenders. Here they are again in large-print haiku form:
Close exposed RDP ports,
Use MFA, and
Patch vulnerable servers.
Why do we keep hammering away at this? Because these three security tenets still aren’t universally adopted, and we see the results. One particular MDR customer last year learned this the hard way, falling victim to compromise four times within a six-month period. With business requirements preventing the customer from addressing the root cause, the attacker gained initial access through the same vector each time – brute force attacks against exposed RDP ports. We’ve changed some of the details to protect the customer’s identity, but we offer a year in the life of their story to encourage our readers to avoid this fate by prioritizing basic security hygiene.
December 2022 (prologue): Initial access occurred via successful brute force attacks against multiple exposed RDP ports. The attacker leveraged multiple PowerSploit modules and Rubeus tooling to compromise authentication, before dropping a number of malicious binaries and downloading an EDR-killer tool. Sophos MDR’s response actions quickly contained the threat. However, the customer declined the MDR recommendation to restrict access to exposed RDP ports, citing business needs.
Recommendations: After this case, MDR recommended the customer close various RDP ports exposed to the internet; the customer declined, citing business needs. (A recommendation for domain-wide credential reset was not addressed; a patching recommendation was likewise unaddressed.)
Summer 2023: Initial access was again achieved through successful brute force attacks against exposed RDP ports. The attacker then created and leveraged the open-source PAExec tool to run Nltest commands to enumerate domain controllers within the estate. Following enumeration, the attacker moved laterally and modified registry values to enable Remote Desktop connections, allow unsolicited remote assistance requests, and disable Network Layer Authentication for RDP.
Recommendations: After this case, MDR reiterated the earlier recommendation that the customer close the exposed RDP ports, and also recommended that the customer enable multifactor authentication, especially if the RDP ports were still required to be exposed. The client again declined the port recommendation and stated that MFA options were under business review.
Through December 2023: About five months later, a welter of attacks hit at approximately two-week intervals, each triggering a fresh round of response engagements. Initial access each time was achieved by brute force against exposed RDP. Once again, following initial access, the attackers performed enumeration, moved laterally and modified registry settings to reduce restrictions on RDP access. Response actions were taken swiftly; however, investigators found a publicly exposed employee web portal with no MFA. Meanwhile, six ports first identified a year earlier were still exposed to the internet. Despite MDR’s persistent recommendations, internal business requirements continued to prevent the customer from implementing the appropriate security measures, leaving them vulnerable to ongoing targeting by threat actors using brute force attacks.
January 2024: Two weeks later, the customer greeted the new year with another attack via the same open ports. The timeframe of this report ends here, but in all likelihood the attacks on the customer did not. The customer’s business requirements do not allow them to restrict access to exposed RDP, nor have they enabled MFA; under those circumstances, there’s not much barrier to wave upon wave of further attacks, nor much further advice incident responders can offer them.
Risk acceptance is up to every organization individually; there is no one-size-fits-all for risk management. However, when the risk as accepted leaves you continually fighting fires in all directions, it’s probably time to reassess. No matter how much the rest of your defenses are tightened, without following basic security principles, the organization will persistently be left defending against threat actors whose initial access could have been stopped at the first hurdle.
Conclusion
Looking back on 2023’s data we are left with a feeling that not enough is being done to protect organizations from harm. Sure, some businesses may have the necessary protections in place, but no one is paying attention. Often, the sole differences between organizations that are breached and ones that aren’t are 1) the preparation entailed by selecting and putting the proper tools in place and 2) the knowledge and readiness to act when required.
Ransomware attacks have reached a stasis point with respect to prevalence, tooling, and timelines. Unfortunately, we are also still seeing the same mistakes being made by defenders every year. It’s with this in mind that we think organizations need to urgently participate in their own rescue. No industry, product, or paradigm is perfect, but we’re still fighting yesterday’s battles with, too often, the day before yesterday’s weaponry. Most of the tools and techniques described in this report have solutions, or at the very least, mitigations to limit their harm, but defenses are simply not keeping up.
Stolen credentials and unpatched systems should be a statistic from a bygone era. Unprotected systems, overprivileged users, and uncontrolled applications are problems that have solutions. Missing telemetry may not be entirely the fault of the victims (determined attackers will continue to make defenders’ work harder by interfering with that), but insufficient logging, or no logging at all, is an unintended oversight at best and a deliberate failure to act at worst. These are all unforced errors, and they must stop now.
A retrospective analysis such as this, especially during a relatively quiet moment in the struggle, is an opportunity to learn from previous mistakes. It can be tempting to look at our failings and get angry that we aren’t progressing like we should. We say: Don’t look back in anger — look forward to how you can make positive change today for a better tomorrow.
Acknowledgements
MDR’s Hilary Wood co-authored this report’s case study (“You got another thing comin’ [and another and another]”); Lee Kirkpatrick contributed the Active Adversary Special Report on RDP (“Remote Desktop Protocol: The Series”) to which this report makes extensive reference. The authors wish to thank Chester Wisniewski for his insights during the analysis process. Figure 6 was excerpted with thanks from work released in 2023 by World Watch – Global CERT – Orange Cyberdefense. Special acknowledgement for Figure 7, which is the work of the late Vitali Kremez. He is greatly missed.
Appendix: Demographics and methodology
As we put together this report, we chose to narrow our focus to 154 cases that could be meaningfully parsed for useful information on the state of the adversary landscape as of the end of 2023. Protecting the confidential relationship between Sophos and our customers is of course our first priority, and the data you see here has been vetted at multiple stages during this process to ensure that no single customer is identifiable through this data – and that no single customer’s data skews the aggregate inappropriately. When in doubt about a specific case, we excluded that customer’s data from the dataset.
Geography
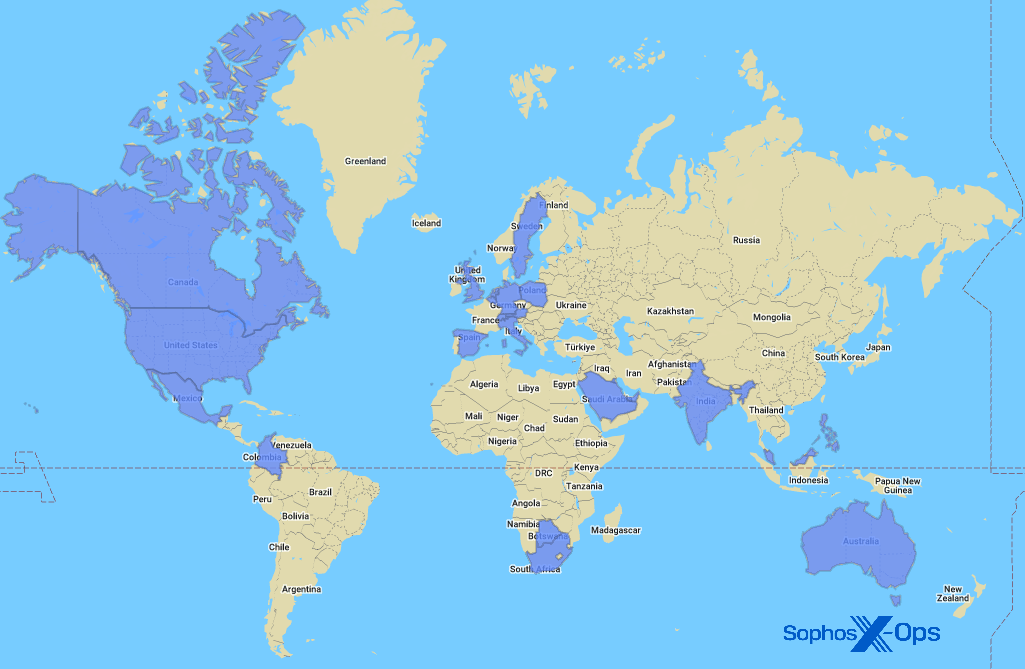
Figure A1: Around the globe and up your street, it’s the Sophos X-Ops IR team
The full list of nations and other locations represented in the 2023 report data is as follows:
| Australia | Italy | Singapore |
| Austria | Kuwait | South Africa |
| Belgium | Malaysia | Spain |
| Botswana | Mexico | Sweden |
| Canada | Netherlands | Switzerland |
| Colombia | Philippines | United Arab Emirates |
| Germany | Poland | United Kingdom |
| India | Saudi Arabia | United States of America |
Industries
The full list of industries represented in the 2023 data for this report is as follows:
| Agriculture | Food | MSP/Hosting |
| Architecture | Government | Non-profit |
| Communication | Healthcare | Pharmaceutical |
| Construction | Hospitality | Real estate |
| Education | Information Technology | Retail |
| Electronics | Legal | Services |
| Energy | Logistics | Transportation |
| Entertainment | Manufacturing | Utilities |
| Financial | Mining |
Methodology
The data in this report was captured over the course of individual investigations undertaken by Sophos’ X-Ops Incident Response team. For this initial report of 2024, we gathered case information on all investigations undertaken by the team in 2023 and normalized it across 43 fields, examining each case to ensure that the data available was appropriate in detail and scope for aggregate reporting as defined by the focus of the proposed report.
When data was unclear or unavailable, the authors worked with individual IR case leads to clear up questions or confusion. Incidents that could not be clarified sufficiently for the purpose of the report, or about which we concluded that inclusion risked exposure or other potential harm to the Sophos-client relationship, were set aside. We then examined each remaining case’s timeline to gain further clarity on such matters as initial ingress, dwell time, exfiltration, and so forth. We retained 154 cases, and those are the foundation of the report.
Leave a Reply